PPT-Frequency Distributions, Histograms,
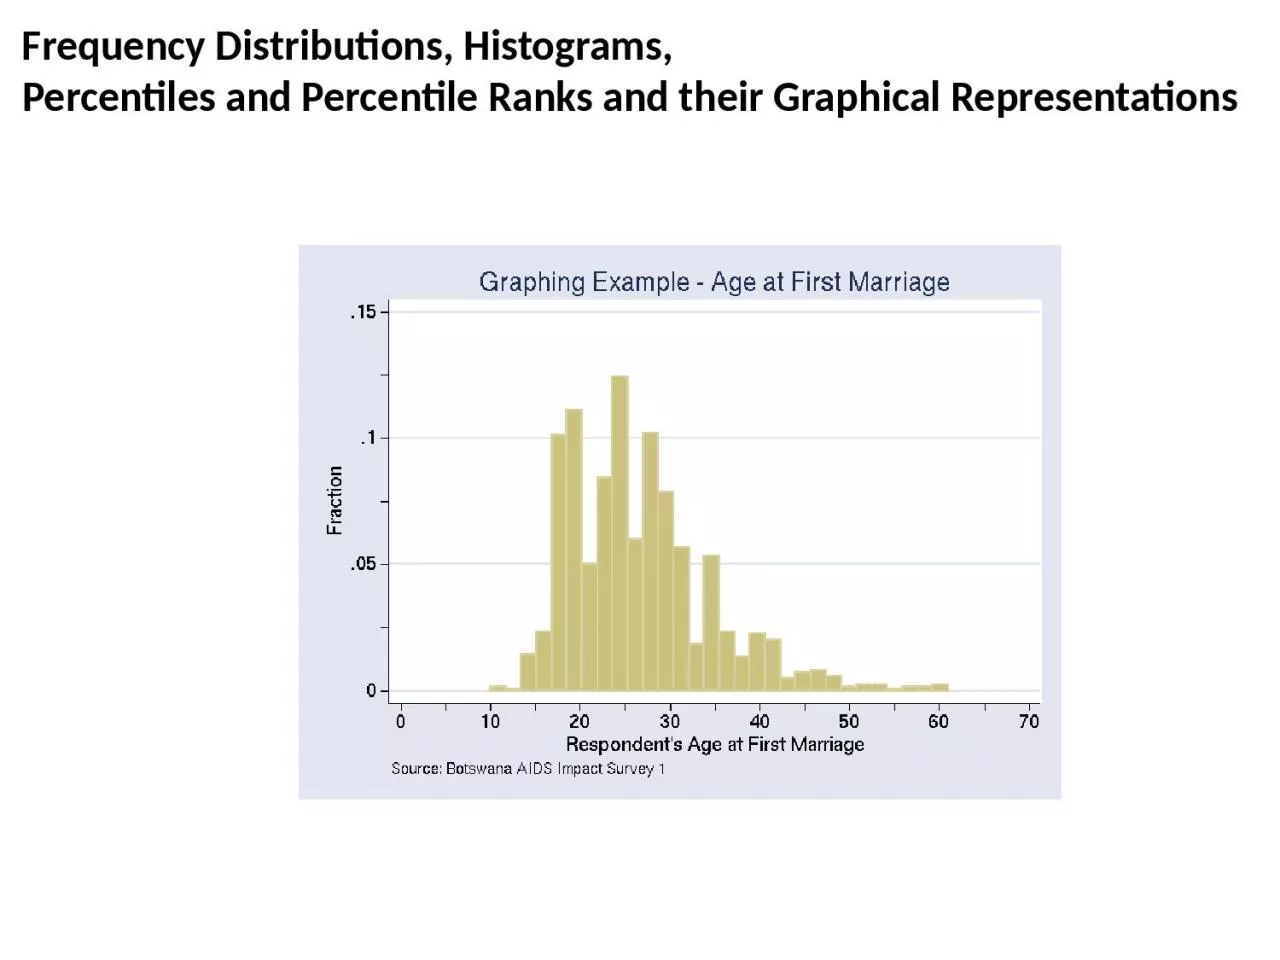
Percentiles and Percentile Ranks and their Graphical Representations Chapter 2 Frequency Distributions Histograms Percentiles and Percentile Ranks How can we represent
Download Presentation
"Frequency Distributions, Histograms," is the property of its rightful owner. Permission is granted to download and print materials on this website for personal, non-commercial use only, provided you retain all copyright notices. By downloading content from our website, you accept the terms of this agreement.
Presentation Transcript
Transcript not available.