/
ABSTRACT CO 2  flux-measurement in dominant tundra vegetation on the Seward Peninsula ABSTRACT CO 2  flux-measurement in dominant tundra vegetation on the Seward Peninsula

ABSTRACT CO 2 flux-measurement in dominant tundra vegetation on the Seward Peninsula - PowerPoint Presentation

faith
faith . @faith
Follow
27 views
Uploaded On 2024-02-02

ABSTRACT CO 2 flux-measurement in dominant tundra vegetation on the Seward Peninsula - PPT Presentation

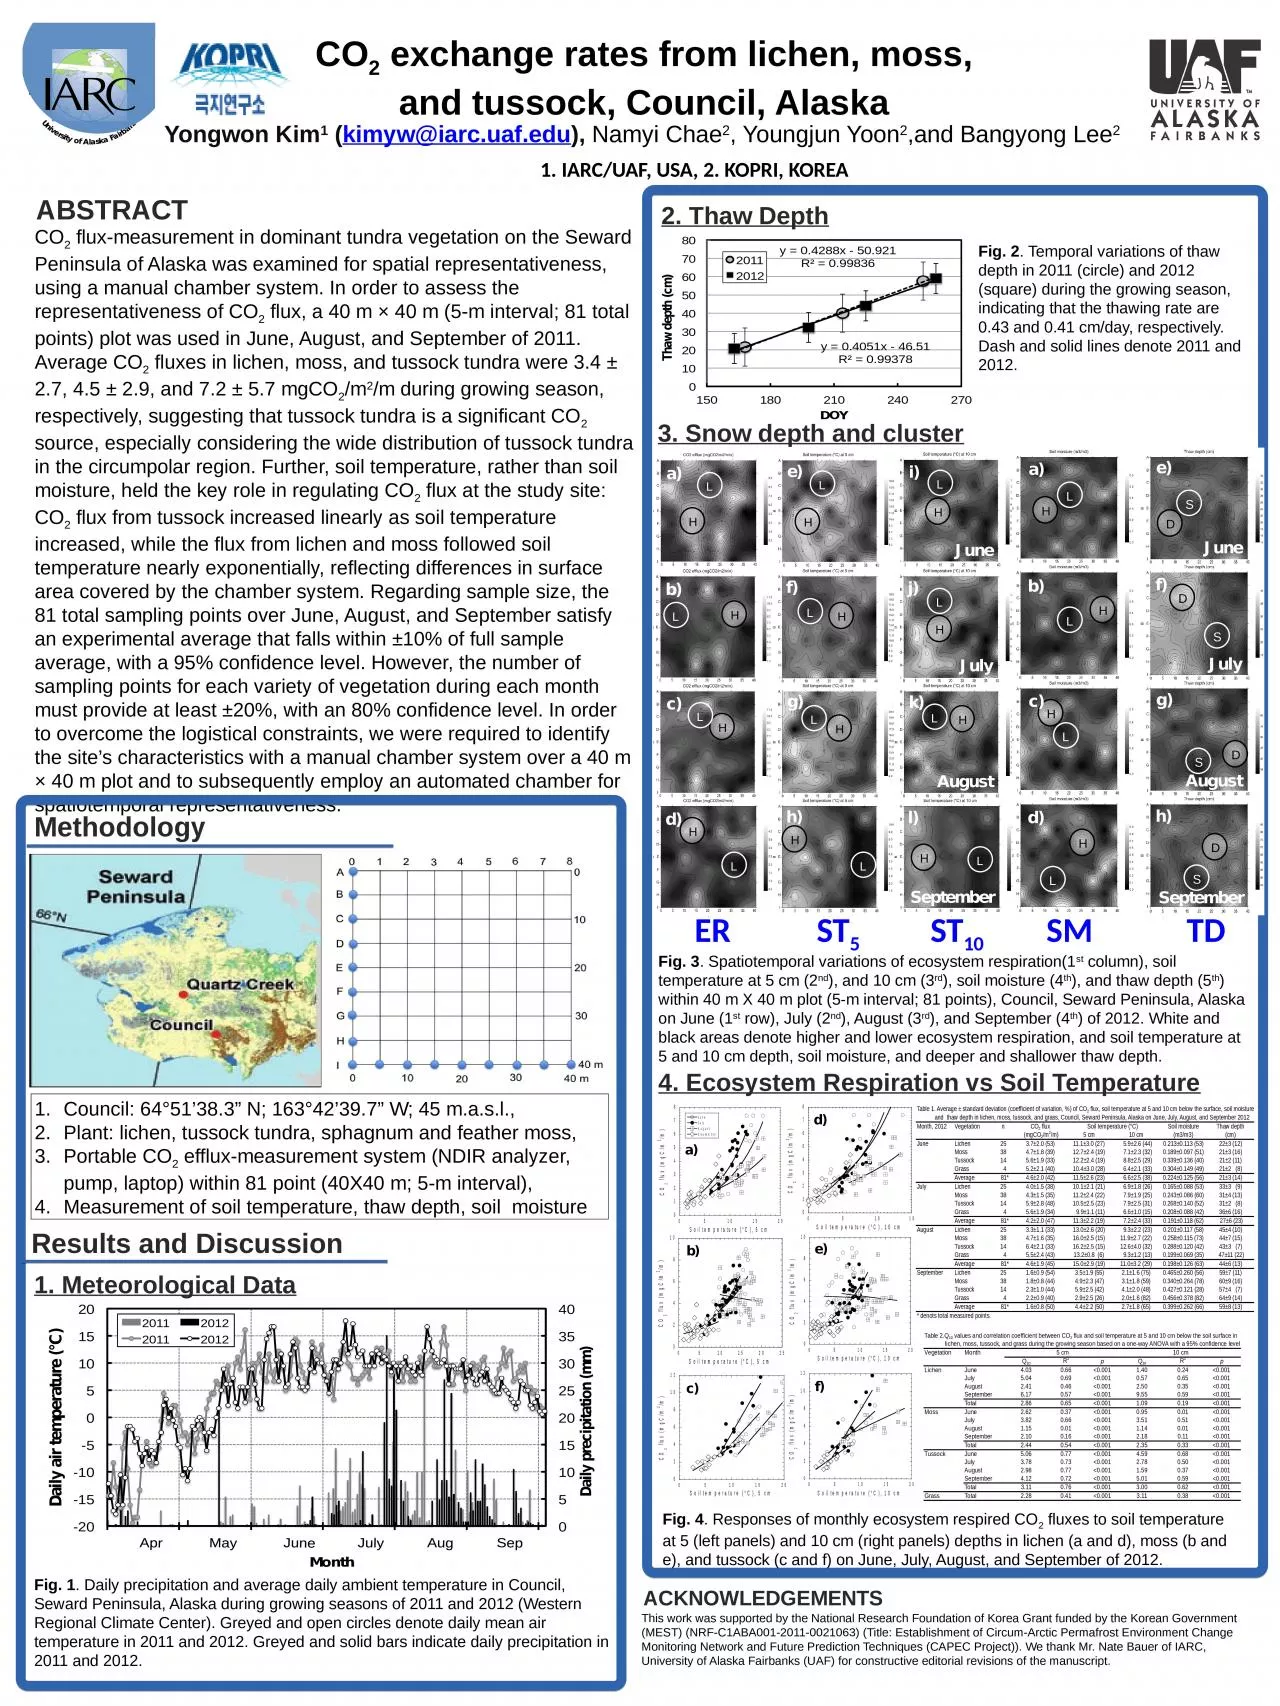
2 flux a 40 m 40 m 5m interval 81 total points plot was used in June August and September of 2011 Average CO 2 fluxes in lichen moss and tussock tundra were 34 27 45 29 and 72 57 mgCO ID: 1043626

temperature soil 2012 co2 soil temperature co2 2012 2011 tussock depth alaska thaw flux tundra lichen moss august september

Share:

Link:

Embed:

Download Presentation from below link

Download Presentation The PPT/PDF document "ABSTRACT CO 2 flux-measurement in domin..." is the property of its rightful owner. Permission is granted to download and print the materials on this web site for personal, non-commercial use only, and to display it on your personal computer provided you do not modify the materials and that you retain all copyright notices contained in the materials. By downloading content from our website, you accept the terms of this agreement.


Presentation Transcript

1. ABSTRACTCO2 flux-measurement in dominant tundra vegetation on the Seward Peninsula of Alaska was examined for spatial representativeness, using a manual chamber system. In order to assess the representativeness of CO2 flux, a 40 m × 40 m (5-m interval; 81 total points) plot was used in June, August, and September of 2011. Average CO2 fluxes in lichen, moss, and tussock tundra were 3.4 ± 2.7, 4.5 ± 2.9, and 7.2 ± 5.7 mgCO2/m2/m during growing season, respectively, suggesting that tussock tundra is a significant CO2 source, especially considering the wide distribution of tussock tundra in the circumpolar region. Further, soil temperature, rather than soil moisture, held the key role in regulating CO2 flux at the study site: CO2 flux from tussock increased linearly as soil temperature increased, while the flux from lichen and moss followed soil temperature nearly exponentially, reflecting differences in surface area covered by the chamber system. Regarding sample size, the 81 total sampling points over June, August, and September satisfy an experimental average that falls within ±10% of full sample average, with a 95% confidence level. However, the number of sampling points for each variety of vegetation during each month must provide at least ±20%, with an 80% confidence level. In order to overcome the logistical constraints, we were required to identify the site’s characteristics with a manual chamber system over a 40 m × 40 m plot and to subsequently employ an automated chamber for spatiotemporal representativeness. MethodologyResults and DiscussionCO2 exchange rates from lichen, moss, and tussock, Council, Alaska Yongwon Kim1 (kimyw@iarc.uaf.edu), Namyi Chae2, Youngjun Yoon2,and Bangyong Lee2 1. IARC/UAF, USA, 2. KOPRI, KOREAACKNOWLEDGEMENTSThis work was supported by the National Research Foundation of Korea Grant funded by the Korean Government (MEST) (NRF-C1ABA001-2011-0021063) (Title: Establishment of Circum-Arctic Permafrost Environment Change Monitoring Network and Future Prediction Techniques (CAPEC Project)). We thank Mr. Nate Bauer of IARC, University of Alaska Fairbanks (UAF) for constructive editorial revisions of the manuscript. Council: 64°51’38.3” N; 163°42’39.7” W; 45 m.a.s.l.,Plant: lichen, tussock tundra, sphagnum and feather moss,Portable CO2 efflux-measurement system (NDIR analyzer, pump, laptop) within 81 point (40X40 m; 5-m interval),Measurement of soil temperature, thaw depth, soil moistureFig. 1. Daily precipitation and average daily ambient temperature in Council, Seward Peninsula, Alaska during growing seasons of 2011 and 2012 (Western Regional Climate Center). Greyed and open circles denote daily mean air temperature in 2011 and 2012. Greyed and solid bars indicate daily precipitation in 2011 and 2012.Fig. 2. Temporal variations of thaw depth in 2011 (circle) and 2012 (square) during the growing season, indicating that the thawing rate are 0.43 and 0.41 cm/day, respectively. Dash and solid lines denote 2011 and 2012.Fig. 3. Spatiotemporal variations of ecosystem respiration(1st column), soil temperature at 5 cm (2nd), and 10 cm (3rd), soil moisture (4th), and thaw depth (5th) within 40 m X 40 m plot (5-m interval; 81 points), Council, Seward Peninsula, Alaska on June (1st row), July (2nd), August (3rd), and September (4th) of 2012. White and black areas denote higher and lower ecosystem respiration, and soil temperature at 5 and 10 cm depth, soil moisture, and deeper and shallower thaw depth. 1. Meteorological Data2. Thaw Depth3. Snow depth and cluster4. Ecosystem Respiration vs Soil TemperatureFig. 4. Responses of monthly ecosystem respired CO2 fluxes to soil temperature at 5 (left panels) and 10 cm (right panels) depths in lichen (a and d), moss (b and e), and tussock (c and f) on June, July, August, and September of 2012.ER ST5 ST10 SM TD