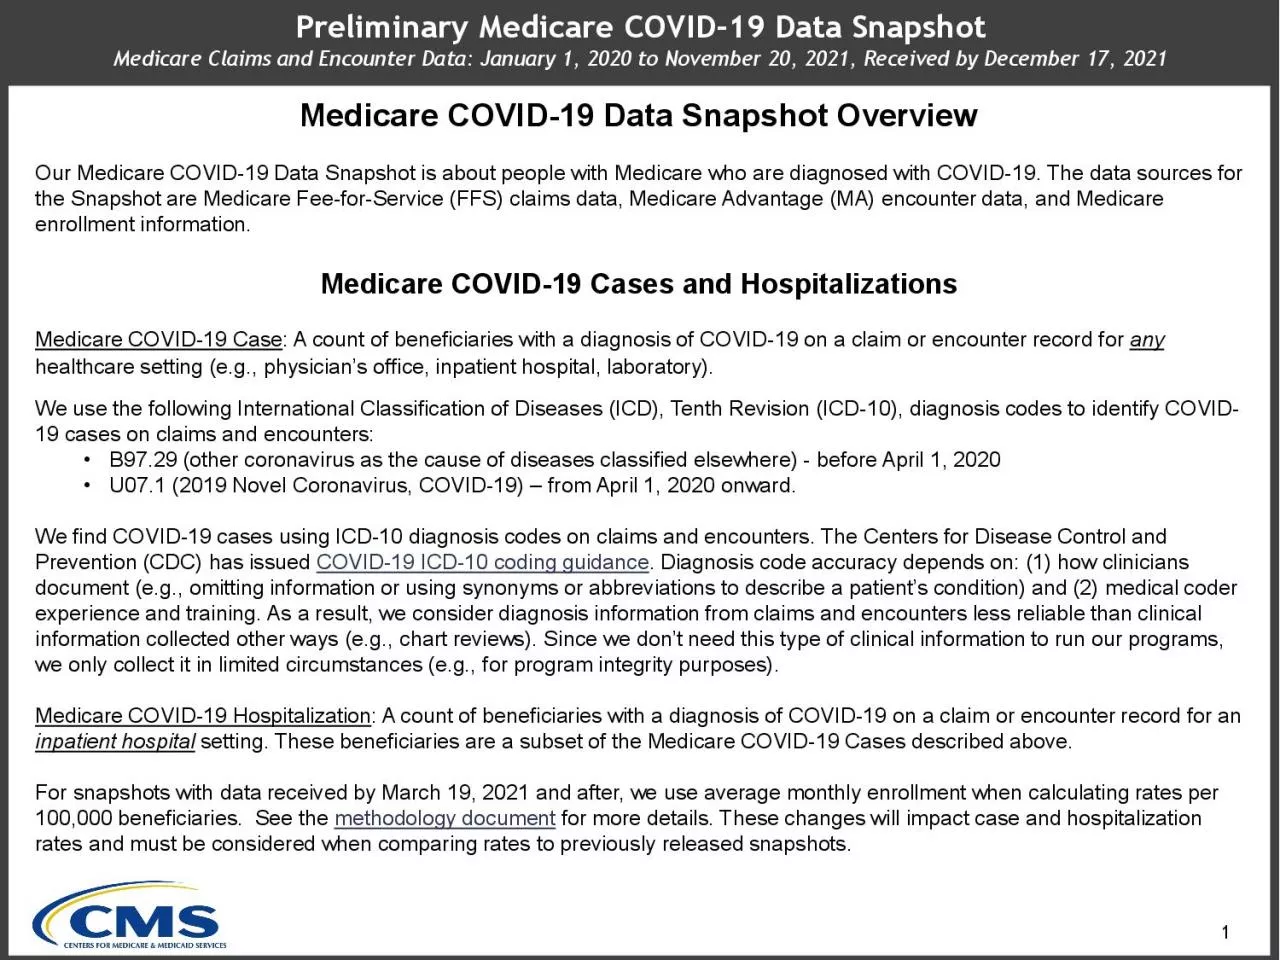
/
Medicare COVID19 Data SnapshotOverviewOur Medicare COVID19 Data Snapsh Medicare COVID19 Data SnapshotOverviewOur Medicare COVID19 Data Snapsh

Medicare COVID19 Data SnapshotOverviewOur Medicare COVID19 Data Snapsh - PDF document

faith
faith . @faith
Follow
342 views
Uploaded On 2021-08-27

Medicare COVID19 Data SnapshotOverviewOur Medicare COVID19 Data Snapsh - PPT Presentation

11Medicare COVID19 Case A count of beneficiaries with a diagnosis of COVID19 on a claim or encounter record for We use the following International Classification of Diseases ICD Tenth Revision ICD10 d ID: 872819

medicare data claims covid19 data medicare covid19 claims 2020 encounter hospitalizations update preliminary additional 100k encounters cases january july

Share:

Link:

Embed:

Download Presentation from below link

Download Pdf The PPT/PDF document "Medicare COVID19 Data SnapshotOverviewOu..." is the property of its rightful owner. Permission is granted to download and print the materials on this web site for personal, non-commercial use only, and to display it on your personal computer provided you do not modify the materials and that you retain all copyright notices contained in the materials. By downloading content from our website, you accept the terms of this agreement.


Presentation Transcript

1 11 Medicare COVID19 Data SnapshotOvervie
11 Medicare COVID19 Data SnapshotOverviewOur Medicare COVID19 Data Snapshot is about people with Medicare who are diagnosed with COVID19. The data sources for the Snapshot are Medicare FeeforService Medicare COVID19 Case: A count of beneficiaries with a diagnosis of COVID19 on a claim or encounter record for We use the following International Classification of Diseases (ICD), Tenth Revision (ICD10), diagnosis codes to identify COVID19 cases on claims and encounters: B97.29 (other coronavirus as the cause of diseases classified elsewhere) before April 1, 2020 COVID19 ICD10 coding guidance Medicare COVID19 Hospitalization: A count of beneficiaries with a diagnosis of COVID19 on a claim or encounter record for an inpatient hospital setting. These beneficiaries are a subset of the Medicare COVID For snapshots with data received by March 19, 2021 and after, we use average monthly enrollment when calculating rates per 100,000 beneficiaries. See the methodology document for more details. These changes will impact case and hospitalization rates and must be considered when comparing rates to previously released snapshots. Preliminary Medicare COVID19 Data SnapshotMedicare Claims and Encounter Data: January 1, 2020 to June 19, 2021Received by July 16, 2021 22 Medicare Enrollee FactsAs of early 2021, around 63.1 million Americans are enrolled in Medicare: in Medicare FeeforService (FFS), also known as Original Medicare, and in Medicare Advantage (MA) plans. Race/Ethnicity DataA person’s race/ethnicity is identified using data collected by the Social Security Administration (SSA) with adjustments to improve the race/ethnicity classification for Hispanic and Asian/Pacific Islander

2 populations. Specifically, CMS worked wi
populations. Specifically, CMS worked with the ResearcTriangle Institute (RTI) to develop an algorithm that uses Census surname lists for likely Hispanic and Asian/Pacific Islanderigin and simple geography (residence in Puerto Rico or Hawaii) to improve the SSA race/ethnicity data. The variable developed usinthis algorithm is often referred to as the RTI Race Code. The race/ethnicity classifications are: American Indian/Alaska Native, White, Black/African American, Asian/Pacific Islander, Hispanic, and Other/Unknown.Note: Even with the application of the RTI algorithm, comparisons to selfreported data show that race/ethnicity is still misclassified for some people (selfreported data is only available through survey and assessment data for a small subset of the Medicare population). The RTI algorithm improves the accuracy of Medicare race/ethnicity data, but continues to undercount people withrace/ethnicity of Asian/Pacific Islander and American Indian/Alaska Native, and to a lesser extent Hispanic, in the Medicare populationMedicare EntitlementMedicare entitlement is available to three basic groups of "insured individuals" people age 65 and older (, younger people with disabilities (disabled), and people with end stage renal disease(ESRD). How a person qualifies for Medicare can change over time (e.g., when a person turns 65 his/her entitlement reason changes to ). For purposes of this snapshot, people who have ESRD, regardless of whether they are also aged or disabled, are classified as ESRDIn all other cases, we use a person’s current reason for entitlement (or disabledFor additional details on data limitations, please see the disclaimer on the next page and view the metho

3 dology document availabl here . Prelimin
dology document availabl here . Preliminary Medicare COVID19 Data SnapshotMedicare Claims and Encounter Data: January 1, 2020 to June 19, 2021Received by July 16, 2021 33 What You Should Know When Using Our Data (DisclaimerYou should use caution when interpreting our data. We collect Medicare claims and encounter data for payment and other program purposes, but not for public health surveillance. There will always be a delay or “claims lag” between when a service occurs and when the claim or encounter for that service is in our database. The length of the lag depends on the service type and program. There may also be longer claims lag due to the pandemic, but we’re not sure of the impact. Historically, 90% of FFS claims across all claim types are submitted within 3 months, while 90% of MA encounters across all claim types are submitted within 12 months. We expect timely FFS claims submissions because providers submit claims directly to us for paymenA longer claims lag is expected for Medicare Advantage encounters because Medicare Advantage Organizations: (1) collect encounters beforesubmitting them to us and (2) have more time to submit encounters because there are different programmatic uses for the data, like risk ustment. Percent of Medicare FFS Claims Received by Time after Date of Service Percent of Medicare Advantage Claims Received by Time after Date of Service Month 1 is the service month (i.e., month for the claim through date); FFS claims analysis based on data for July 2016; MA encounter data shows the % of encounters reported to us by 30 day increments from the through date of the service for January 2018. The data in this table is meant todescriptive

4 , but shouldn’t be used to adjust d
, but shouldn’t be used to adjust data presented in this update due to pandemicrelated claims submission uncertainties Claim Type1 Month2 Months3 Months6 Months9 Months12 MonthsInpatientSNF HospiceHome HealthOutpatientCarrierDME Claim Type1 Month2 Months3 Months6 Months9 Months12 MonthsInpatientSNFHome HealthOutpatientProfessionalDME Preliminary Medicare COVID19 Data SnapshotMedicare Claims and Encounter Data: January 1, 2020 to June 19, 2021Received by July 16, 2021 44 COVID19 Cases per 100K by Geography Map Scale: per 100K 1,3384,0784,0796,7016,7027,9487,9499,3179,31811,299 Disclaimer : All data presented in this update are preliminary and will continue to change as CMS processes additional claims and encounters for the reporting period.COVIDcases are identified using the following ICD10 diagnosis codes: B97.29 (from ) and U07.1 (4/1/2020 and after). Medicare claims and encounter data are collected for payment and other program purposes, not public health surveillance, so caution must be used when interpreting the data.For additional details on data limitations, please see page of this data update and view the methodology document available here . Preliminary Medicare COVID19 Data Snapshot: Medicare Claims and Encounter Data: January 1, 2020 to June 19, 2021Received by July 16, 2021COVID19 Cases 4,545,445Total COVID19 CasesCOVID19 Cases per 100kRural Areasper 100KUrban Areas:per 100K7,3347,254 55 COVID19 Case Trend Week Ending: Disclaimer : All data presented in this update are preliminary and will continue to change as CMS processes additional claims and encounters for the reporting period.COVIDcases are identified using the following ICD10 diagnosis codes: B97.29 (from

5 ) and U07.1 (4/1/2020 and after). Medic
) and U07.1 (4/1/2020 and after). Medicare claims and encounter data are collected for payment and other program purposes, not public health surveillance, so caution must be used when interpreting the data.For additional details on data limitations, please see page of this data update and view the methodology document available here . Preliminary Medicare COVID19 Data Snapshot: Medicare Claims and Encounter Data: January 1, 2020 to June 19, 2021Received by July 16, 2021COVID19 Cases 50,000100,000150,000200,000250,000 4,545,445Total COVID19 CasesCOVID19 Cases per 100k Note: Data for recent weeks is likely to be adjusted upward due to claims lag; see page 2 of this data update for additional ails on claims lag.The downward trend that appears in early 2021 is likely due to a number of factors, including continued use of masks, social distancing and the availability of multiple vaccines to protect against COVID19. For data on COVID19 vaccinations, visit the CDC COVID19 Data Tracker here: https://covid.cdc.gov/coviddatatracker/#vaccinations . 66 7,0277,39722,495AgedDisabledESRD 13,3695,794Dual Medicare andMedicaidMedicare Only COVID19 Cases per 100K by Beneficiary Characteristics 7,4746,900FemaleMale 10,6955,0989,02710,1586,7205,277AI/ANAsian/PacificIslanderBlack/AfricanAmericanHispanicWhiteOth/Unk 7,8045,9757,35711,171565-7475-8485+ Disclaimer : All data presented in this update are preliminary and will continue to change as CMS processes additional claims and encounters for the reporting period.COVIDcases are identified using the following ICD10 diagnosis codes: B97.29 (from ) and U07.1 (4/1/2020 and after). Medicare claims and encounter data are collected for payment and other

6 program purposes, not public health surv
program purposes, not public health surveillance, so caution must be used when interpreting the data.For additional details on data limitations, please see page of this data update and view the methodology document available here . Preliminary Medicare COVID19 Data Snapshot: Medicare Claims and Encounter Data: January 1, 2020 to June 19, 2021Received by July 16, 2021COVID19 Cases Note: AI/AN = American Indian/Alaska Native4,545,445Total COVID19 CasesCOVID19 Cases per 100k 77 5,7325,59317,18115,3358,97429,327AgedDisabledESRD 5,8105,77513,93312,542FemaleMale 8,2953,5156,4727,6555,6724,23714,7328,04613,43614,68613,65510,948AI/ANAsian/PacificIslanderBlack/AfricanAmericanHispanicWhiteOth/Unk 5,8635,0735,9878,2689,45311,83116,60525,080 5 65-74 75-84 85+ Disclaimer : All data presented in this update are preliminary and will continue to change as CMS processes additional claims and encounters for the reporting period.COVIDcases are identified using the following ICD10 diagnosis codes: B97.29 (from ) and U07.1 (4/1/2020 and after). Medicare claims and encounter data are collected for payment and other program purposes, not public health surveillance, so caution must be used when interpreting the data.For additional details on data limitations, please see page of this data update and view the methodology document available here . COVID19 Cases per 100K by Beneficiary Characteristics Medicare Only vs. Dual Medicare and Medicaid Eligibility Preliminary Medicare COVID19 Data Snapshot: Medicare Claims and Encounter Data: January 1, 2020 to June 19, 2021, Received by July 16, 2021COVID19 Cases Note: AI/AN = American Indian/Alaska Native4,545,445Total COVID19 CasesCOVID19 Cases per 100k 88 CO

7 VID19 Cases per 100K by Beneficiary Char
VID19 Cases per 100K by Beneficiary Characteristics By Race/Ethnicity Disclaimer : All data presented in this update are preliminary and will continue to change as CMS processes additional claims and encounters for the reporting period.COVID19 hospitalizations are identified using the following ICD10 diagnosis codes: B97.2(from 3/31/2020) and U07.1 (4/1/2020 and after). Medicare claims and encounter data are collected for payment and other program purposes, not public health surveillance, so caution must be used when interpreting the data.For additional details ondata limitations, please see page of this data update and view the methodology document available here Note: AI/AN = American Indian/Alaska Native Preliminary Medicare COVID19 Data Snapshot: Medicare Claims and Encounter Data: January 1, 2020 to June 19, 2021Received by July 16, 2021COVID19 Cases 10,2349,88911,32213,9856,8544,2745,0807,6929,5557,7049,70112,88311,2359,41310,19611,711 6,5865,4226,89611,139Less than 6565-7475-8485 and over AI/AN Asian/Pacific Islander Black/African American Hispanic White 10,5369,03930,7514,8656,15517,0118,5318,76723,9219,74110,38728,5206,6846,45619,248AgedDisabledESRD4,545,445Total COVID19 CasesCOVID19 Cases per 100k 99 COVID19 Cases per 100K by Beneficiary Characteristics By Race/Ethnicity Disclaimer : All data presented in this update are preliminary and will continue to change as CMS processes additional claims and encounters for the reporting period.COVID19 hospitalizations are identified using the following ICD10 diagnosis codes: B97.2(from 3/31/2020) and U07.1 (4/1/2020 and after). Medicare claims and encounter data are collected for payment and other program purposes, not public

8 health surveillance, so caution must be
health surveillance, so caution must be used when interpreting the data.For additional details ondata limitations, please see page of this data update and view the methodology document available here Note: AI/AN = American Indian/Alaska Native Preliminary Medicare COVID19 Data Snapshot: Medicare Claims and Encounter Data: January 1, 2020 to June 19, 2021Received by July 16, 2021COVID19 Cases 11,12610,1404,8935,3579,3698,57610,4339,8366,9716,419FemaleMale AI/AN Asian/Pacific Islander Black/African American Hispanic White 8,29514,7323,5158,0466,47213,4367,65514,6865,67213,655Medicare OnlyDual Medicare and Medicaid4,545,445Total COVID19 CasesCOVID19 Cases per 100k 1010 1,278,572Total COVID19 HospitalizationsCOVID19 Hospitalizations per 100k COVIDHospitalizations per 100K by Geography Map Scale: per 100K 1,7201,7212,0472,0482,4752,4762,893 Disclaimer : All data presented in this update are preliminary and will continue to change as CMS processes additional claims and encounters for the reporting period.COVID19 hospitalizations are identified using the following ICD10 diagnosis codes: B97.29 (from 3/31/2020) and U07.1 (4/1/2020 and after). Medicare claims and encounter data are collected for payment and other program purposes, not public health surveillance, so caution must be used when interpreting the data.For additional details on data limitations, please see page of this data update and view the methodology document available here . Preliminary Medicare COVID19 Data Snapshot: Medicare Claims and Encounter Data: January 1, 2020 to June 19, 2021Received by July 16, 2021COVID19 Hospitalizations Rural Areas:per Urban Areas:per 1,9892,072 1111 COVID19 Hospitalizations Trend Week E

9 nding: Disclaimer : All data presented i
nding: Disclaimer : All data presented in this update are preliminary and will continue to change as CMS processes additional claims and encounters for the reporting period.COVID19 hospitalizations are identified using the following ICD10 diagnosis codes: B97.29 (from 3/31/2020) and U07.1 (4/1/2020 and after). Medicare claims and encounter data are collected for payment and other program purposes, not public health surveillance, so caution must be used when interpreting the data.For additional details on data limitations, please see page of this data update and view the methodology document available here . Preliminary Medicare COVID19 Data Snapshot: Medicare Claims and Encounter Data: January 1, 2020 to June 19, 2021Received by July 16, 2021COVID19 Hospitalizations 10,00020,00030,00040,00050,00060,000 70,000 1,278,572Total COVID19 HospitalizationsCOVID19 Hospitalizations per 100k Note: Data for recent weeks is likely to be adjusted upward due to claims lag; see page 2 of this data update for additional ails on claims lag.The downward trend that appears in early 2021 is likely due to a number of factors, including continued use of masks, social distancing and the availability of multiple vaccines to protect against COVID19. For data on COVID19 vaccinations, visit the CDC COVID19 Data Tracker here: https://covid.cdc.gov/coviddatatracker/#vaccinations . 1212 1,9731,78711,972AgedDisabledESRD 4,0981,576Dual Medicare andMedicaidMedicare Only COVID19 Hospitalizations per 100K by Beneficiary Characteristics Disclaimer : All data presented in this update are preliminary and will continue to change as CMS processes additional claims and encounters for the reporting period.COVID19 hospi

10 talizations are identified using the fol
talizations are identified using the following ICD10 diagnosis codes: B97.2(from 3/31/2020) and U07.1 (4/1/2020 and after). Medicare claims and encounter data are collected for payment and other program purposes, not public health surveillance, so caution must be used when interpreting the data.For additional details ondata limitations, please see page of this data update and view the methodology document available here . Preliminary Medicare COVID19 Data Snapshot: Medicare Claims and Encounter Data: January 1, 2020 to June 19, 2021Received by July 16, 2021COVID19 Hospitalizations Note: AI/AN = American Indian/Alaska Native 4,3271,6193,4372,9831,7521,290AI/ANAsian/PacificIslanderBlack/AfricanAmericanHispanicWhiteOth/Unk 1,8822,227FemaleMale 2,0511,4402,3443,686565-7475-8485+1,278,572Total COVID19 HospitalizationsCOVID19 Hospitalizations per 100k 1313 1,5521,2389,0184,7762,26715,821AgedDisabledESRD COVID19 Hospitalizations per 100K by Beneficiary Characteristics Medicare Only vs. Dual Medicare and Medicaid Eligibility 1,3761,8033,8954,393FemaleMale 3,4841,0332,4501,9691,4815,7912,8075,1714,8623,5623,320AI/ANAsian/PacificIslanderBlack/AfricanAmericanHispanicWhiteOth/Unk 1,4151,0921,8552,9792,5923,7805,7617,194565-7475-8485+ Disclaimer : All data presented in this update are preliminary and will continue to change as CMS processes additional claims and encounters for the reporting period.COVID19 hospitalizations are identified using the following ICD10 diagnosis codes: B97.2(from 3/31/2020) and U07.1 (4/1/2020 and after). Medicare claims and encounter data are collected for payment and other program purposes, not public health surveillance, so caution must be used when interpretin

11 g the data.For additional details ondata
g the data.For additional details ondata limitations, please see page of this data update and view the methodology document available here . Preliminary Medicare COVID19 Data Snapshot: Medicare Claims and Encounter Data: January 1, 2020 to June 19, 2021, Received by July 16, 2021COVID19 Hospitalizations Note: AI/AN = American Indian/Alaska Native1,278,572Total COVID19 HospitalizationsCOVID19 Hospitalizations per 100k 1414 COVID19 Hospitalizations per 100K by Beneficiary Characteristics By Race/Ethnicity Disclaimer : All data presented in this update are preliminary and will continue to change as CMS processes additional claims and encounters for the reporting period.COVID19 hospitalizations are identified using the following ICD10 diagnosis codes: B97.2(from 3/31/2020) and U07.1 (4/1/2020 and after). Medicare claims and encounter data are collected for payment and other program purposes, not public health surveillance, so caution must be used when interpreting the data.For additional details ondata limitations, please see page of this data update and view the methodology document available here . Preliminary Medicare COVID19 Data Snapshot: Medicare Claims and Encounter Data: January 1, 2020 to June 19, 2021, Received by July 16, 2021COVID19 Hospitalizations Note: AI/AN = American Indian/Alaska Native 3,6083,9535,0726,0602,1691,1161,8123,0433,1562,7614,2545,7252,9132,4243,3744,5801,5131,1582,0463,421Less than 6565-7475-8485 and over AI/AN Asian/Pacific Islander Black/African American Hispanic White 4,3512,89217,3891,5121,7168,8443,3062,62413,4352,8562,31515,4831,7491,4329,531AgedDisabledESRD1,278,572Total COVID19 HospitalizationsCOVID19 Hospitalizations per 100k 1515 COVID19

12 Hospitalizations per 100K by Beneficiary
Hospitalizations per 100K by Beneficiary Characteristics By Race/Ethnicity Disclaimer : All data presented in this update are preliminary and will continue to change as CMS processes additional claims and encounters for the reporting period.COVID19 hospitalizations are identified using the following ICD10 diagnosis codes: B97.2(from 3/31/2020) and U07.1 (4/1/2020 and after). Medicare claims and encounter data are collected for payment and other program purposes, not public health surveillance, so caution must be used when interpreting the data.For additional details ondata limitations, please see page of this data update and view the methodology document available here . Preliminary Medicare COVID19 Data Snapshot: Medicare Claims and Encounter Data: January 1, 2020 to June 19, 2021, Received by July 16, 2021COVID19 Hospitalizations Note: AI/AN = American Indian/Alaska Native 4,2214,4631,3471,9583,3523,5502,6433,3791,5961,938FemaleMale AI/AN Asian/Pacific Islander Black/African American Hispanic White 3,4845,7911,0332,8072,4505,1711,9694,8621,4813,562Medicare OnlyDual Medicare and Medicaid1,278,572Total COVID19 HospitalizationsCOVID19 Hospitalizations per 100k 1616 8-1011-1516-2021-3031+ Disclaimer : All data presented in this update are preliminary and will continue to change as CMS processes additional claims and encounters for the reporting period.COVID19 hospitalizations are identified using the following ICD10 diagnosis codes: B97.29 (from 3/31/2020) and U07.1 (4/1/2020 and after). Medicare claims and encounter data are collected for payment and other program purposes, not public health surveillance, so caution must be used when interpreting the data.For additional details

13 on data limitations, please see page of
on data limitations, please see page of this data update and view the methodology document available here . HomeSkilled Nursing FacilityHome HealthExpiredHospiceAnother Health Care FacilityAssisted Living/Nursing HomeOther Days 7 days = Percent of COVID19 Hospitalizations by Discharge Status Percent of COVID19 Hospitalizations by Length of Stay Note : Percentages may not add to 100% because of rounding. Preliminary Medicare COVID19 Data Snapshot: Medicare Claims and Encounter Data: January 1, 2020 to June 19, 2021, Received by July 16, 2021COVID19 Hospitalizations 1,278,572Total COVID19 HospitalizationsCOVID19 Hospitalizations per 100k 1717 Disclaimer : All data presented in this update are preliminary and will continue to change as CMS processes additional claims and encounters for the reporting period.COVID19 hospitalizations are identified using the following ICD10 diagnosis codes: B97.29 (from 3/31/2020) and U07.1 (4/1/2020 and after). Medicare claims and encounter data are collected for payment and other program purposes, not public health surveillance, so caution must be used when interpreting the data.For additional details on data limitations, please see page of this data update and view the methodology document available here . HypertensionHyperlipidemiaChronic Kidney DiseaseIschemic Heart DiseaseDiabetesAnemiaRheumatoid Arthritis/OsteoarthritisHeart FailureObesityDepressionAlzheimer Disease/DementiaPeripheral Vascular DiseaseCOPDAtrial FibrillationCancerAsthmaStrokeOsteoporosisSchizophrenia Chronic Condition Prevalence Among Feefor Service COVID19 Hospitalized Beneficiaries Medicare Payments for Feefor Service COVID19 Hospitalizations Preliminary Medicare COVID

14 19 Data Snapshot: Medicare Claims and En
19 Data Snapshot: Medicare Claims and Encounter Data: January 1, 2020 to June 19, 2021, Received by July 16, 2021COVID19 Hospitalizations Total FeeforService COVID19 Hospitalizations $18.6BTotal Medicare payment for feeforservice COVID19 hospitalizations$24,557$3,936(5th percentile) $67,958(95th percentile)Average Medicare payment per feeforservice COVID19 hospitalized beneficiary 1313 1,5521,2389,0184,7762,26715,821AgedDisabledESRD COVID19 Hospitalizations per 100K by Beneficiary Characteristics Medicare Only vs. Dual Medicare and Medicaid Eligibility 1,3761,8033,8954,393FemaleMale 3,4841,0332,4501,9691,4815,7912,8075,1714,8623,5623,320AI/ANAsian/PacificIslanderBlack/AfricanAmericanHispanicWhiteOth/Unk 1,4151,0921,8552,9792,5923,7805,7617,194565-7475-8485+ Disclaimer : All data presented in this update are preliminary and will continue to change as CMS processes additional claims and encounters for the reporting period.COVID19 hospitalizations are identified using the following ICD10 diagnosis codes: B97.2(from 3/31/2020) and U07.1 (4/1/2020 and after). Medicare claims and encounter data are collected for payment and other program purposes, not public health surveillance, so caution must be used when interpreting the data.For additional details ondata limitations, please see page of this data update and view the methodology document available here . Preliminary Medicare COVID19 Data Snapshot: Medicare Claims and Encounter Data: January 1, 2020 to June 19, 2021, Received by July 16, 2021COVID19 Hospitalizations Note: AI/AN = American Indian/Alaska Native1,278,572Total COVID19 HospitalizationsCOVID19 Hospitalizations per 100k 1010 1,278,572Total COVID19 HospitalizationsCOVID19

15 Hospitalizations per 100k COVID19 Hospi
Hospitalizations per 100k COVID19 Hospitalizations per 100K by Geography Map Scale: per 100K 1,7201,7212,0472,0482,4752,4762,893 Disclaimer : All data presented in this update are preliminary and will continue to change as CMS processes additional claims and encounters for the reporting period.COVID19 hospitalizations are identified using the following ICD10 diagnosis codes: B97.29 (from 3/31/2020) and U07.1 (4/1/2020 and after). Medicare claims and encounter data are collected for payment and other program purposes, not public health surveillance, so caution must be used when interpreting the data.For additional details on data limitations, please see page of this data update and view the methodology document available here . Preliminary Medicare COVID19 Data Snapshot: Medicare Claims and Encounter Data: January 1, 2020 to June 19, 2021Received by July 16, 2021COVID19 Hospitalizations Rural Areas:per Urban Areas:per 1,9892,072 77 5,7325,59317,18115,3358,97429,327AgedDisabledESRD 5,8105,77513,93312,542FemaleMale 8,2953,5156,4727,6555,6724,23714,7328,04613,43614,68613,65510,948AI/ANAsian/PacificIslanderBlack/AfricanAmericanHispanicWhiteOth/Unk 5,8635,0735,9878,2689,45311,83116,60525,080 5 65-74 75-84 85+ Disclaimer : All data presented in this update are preliminary and will continue to change as CMS processes additional claims and encounters for the reporting period.COVIDcases are identified using the following ICD10 diagnosis codes: B97.29 (from ) and U07.1 (4/1/2020 and after). Medicare claims and encounter data are collected for payment and other program purposes, not public health surveillance, so caution must be used when interpreting the data.For additional details on da

16 ta limitations, please see page of this
ta limitations, please see page of this data update and view the methodology document available here . COVID19 Cases per 100K by Beneficiary Characteristics Medicare Only vs. Dual Medicare and Medicaid Eligibility Preliminary Medicare COVID19 Data Snapshot: Medicare Claims and Encounter Data: January 1, 2020 to June 19, 2021, Received by July 16, 2021COVID19 Cases Note: AI/AN = American Indian/Alaska Native4,545,445Total COVID19 CasesCOVID19 Cases per 100k 44 COVID19 Cases per 100K by Geography Map Scale: per 100K 1,3384,0784,0796,7016,7027,9487,9499,3179,31811,299 Disclaimer : All data presented in this update are preliminary and will continue to change as CMS processes additional claims and encounters for the reporting period.COVIDcases are identified using the following ICD10 diagnosis codes: B97.29 (from ) and U07.1 (4/1/2020 and after). Medicare claims and encounter data are collected for payment and other program purposes, not public health surveillance, so caution must be used when interpreting the data.For additional details on data limitations, please see page of this data update and view the methodology document available here . Preliminary Medicare COVID19 Data Snapshot: Medicare Claims and Encounter Data: January 1, 2020 to June 19, 2021Received by July 16, 2021COVID19 Cases 4,545,445Total COVID19 CasesCOVID19 Cases per 100kRural Areasper 100KUrban Areas:per 100K7,3347,254 33 What You Should Know When Using Our Data (DisclaimerYou should use caution when interpreting our data. We collect Medicare claims and encounter data for payment and other program purposes, but not for public health surveillance. There will always be a delay or “claims lag” between wh

17 en a service occurs and when the claim o
en a service occurs and when the claim or encounter for that service is in our database. The length of the lag depends on the service type and program. There may also be longer claims lag due to the pandemic, but we’re not sure of the impact. Historically, 90% of FFS claims across all claim types are submitted within 3 months, while 90% of MA encounters across all claim types are submitted within 12 months. We expect timely FFS claims submissions because providers submit claims directly to us for paymenA longer claims lag is expected for Medicare Advantage encounters because Medicare Advantage Organizations: (1) collect encounters beforesubmitting them to us and (2) have more time to submit encounters because there are different programmatic uses for the data, like risk ustment. Percent of Medicare FFS Claims Received by Time after Date of Service Percent of Medicare Advantage Claims Received by Time after Date of Service Month 1 is the service month (i.e., month for the claim through date); FFS claims analysis based on data for July 2016; MA encounter data shows the % of encounters reported to us by 30 day increments from the through date of the service for January 2018. The data in this table is meant todescriptive, but shouldn’t be used to adjust data presented in this update due to pandemicrelated claims submission uncertainties Claim Type1 Month2 Months3 Months6 Months9 Months12 MonthsInpatientSNF HospiceHome HealthOutpatientCarrierDME Claim Type1 Month2 Months3 Months6 Months9 Months12 MonthsInpatientSNFHome HealthOutpatientProfessionalDME Preliminary Medicare COVID19 Data SnapshotMedicare Claims and Encounter Data: January 1, 2020 to June 19, 2021Received by Ju