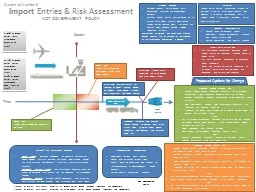
/
1 Import Price Index Bias 1 Import Price Index Bias

1 Import Price Index Bias - PowerPoint Presentation

faustina-dinatale
faustina-dinatale . @faustina-dinatale
Follow
403 views
Uploaded On 2017-04-23

1 Import Price Index Bias - PPT Presentation

W Erwin Diewert Alice O Nakamura This builds on our 2010 paper 2 Bias Due to Input Source Substitutions Can It Be Measured May 2 2010 W Erwin Diewert and Alice O Nakamura1 Discussion Paper 1006 ID: 540732

data price index product price data product index period business mpi input bias import walmart suppliers paper alterman statistics

Share:

Link:

Embed:

Download Presentation from below link

Download Presentation The PPT/PDF document "1 Import Price Index Bias" is the property of its rightful owner. Permission is granted to download and print the materials on this web site for personal, non-commercial use only, and to display it on your personal computer provided you do not modify the materials and that you retain all copyright notices contained in the materials. By downloading content from our website, you accept the terms of this agreement.


Presentation Transcript

Slide1

1

Import Price Index Bias

W. Erwin Diewert

Alice O. Nakamura

This builds on our 2010 paper:Slide2

2

Bias Due to Input Source Substitutions: Can It Be Measured?

May 2, 2010

W. Erwin Diewert and Alice O. Nakamura1

Discussion Paper 10-06

Department of Economics

University of British Columbia

Vancouver, Canada, V6T 1Z1

Email addresses: diewert@econ.ubc.ca ; alice.nakamura@ualberta.caSlide3

3

Houseman, Susan N. 2011. "Offshoring and Import Price Measurement." Survey of Current Business, February, pp. 7-11

.

The Problem:

“As currently constructed, import price

indexes generally do not capture price declines, often large, associated with shifts in sourcing. This has prompted concerns that the real (constant-dollar) growth in imports has been understated and that domestic productivity and real output growth measures have been overstated.”Slide4

4

“Solution: Correcting the Bias Through a Buyer’s Index”

BLS has proposed a solution : construct a true input price index based on a survey of buyers (Alterman 2009).

In principle, the purchaser of the inputs should be able to report price changes in products irrespective of the source. Slide5

5

Houseman goes on to write:“The proposed survey would address biases in the input price index for shifts in sourcing among domestic suppliers as well as among domestic and foreign suppliers.”Slide6

6

And, Susan Houseman also notes:

“The immediate benefit of addressing this bias to the input price index is improved statistics in the BEA industry accounts.

One drawback of the proposed input price index is that it will not directly address biases in the import price indexes, so it will not address biases to real GDP growth, as measured using the expenditure approach, from shifts in sourcing.Slide7

7

(1) GDP = C + I + G + X - M.

To compute real GDP growth, all components of nominal GDP must be properly deflated to control for price changes.

The MPI is used to deflate the import component, M.

Hence in our paper, we focus on the MPI.Slide8

8

1. One source of MPI bias is the price collection gap between the MPI and PPI programs.

When a producer changes from buying an intermediate input from a domestic source to buying that same input from a foreign producer, the product price will drop out of the domain of definition for the PPI and will become part of the domain of definition for the MPI.

As a consequence, any price change associated with that sourcing substitution will not be included in either the PPI or the MPI. Slide9

9

A second procedural cause is that the operational definition of a product in the MPI data is a contract between a particular buyer and seller.

Operationally, this means that if either the buyer or the seller make changes that result in a new contract, the price change between the old and new contracts is likely to be missed.

This includes when the seller introduces a trivially different new version of a product as a way of trying to disguise a price increase.Slide10

10

The price indexes in use for inter-temporal comparisons are designed for an economy where each product has ONE price in each time period.

However, the seller and buyer actions that have led to concerns about MFP bias inevitably lead to situations in which products often are transacted for many different prices in each time period.Slide11

11

How then should do we measure inflation for a homogeneous sold in a variety of prices each time period?

“Throughout the country during the period a commodity is not sold at one price, nor even at one wholesale price in its principal market. Various quantities of it are sold at different prices, and the full value is obtained by adding all the sums spent ... and the average price is found by dividing the total sum (or the full value) by the total quantities.”

Correa Moylan Walsh (1921a, p. 88)Slide12

12

AXIOMATIC AND ECONOMIC APPROACHES TO ELEMENTARY PRICE INDEXES

W. Erwin Diewert

http://faculty.arts.ubc.ca/ediewert/axio.pdf

Thus Walsh and Davies simply took as an axiom that the appropriate period t measure of price at the elementary establishment and detailed product level is the

unit value

and the corresponding period t measure of quantity at this elementary level is

total quantity sold.

Slide13

13

One other important detail of the price collection process is that it is intended to yield a single

price observation per period for each establishment where a product is being priced, as is standard statistical agency practice.

For the multistage design that is used to select specific import items, probability sampling is used at each stage. This makes it less likely that the same product item will be priced at multiple establishments.

Slide14

14

How can we end up with enough observations to support the sort unit value pricing for homogenous products?

Electronic data collection from business data bases would help.

This is what Statistics Iceland has been doing for some time now for their Producer Price Index.

Collecting electronic data directly from the accounts of firms enables the calculation of a superlative PPI index on a monthly basis. Slide15

15

Statistics Iceland expanded their new data collect approach company by company, building trust.

Business are having to learn to be more comfortable about others having access to their data bases anyway because of how supply chains increasingly are being managed.

A defining choice for this company was when the decision was taken to share the company’s customer purchase data with its suppliers was a critically important choice for Walmart.

What Walmart recognized was that by sharing this information with its suppliers, they could all gain from improved coordination on production and inventory levels. Slide16

16

Businesses like Walmart have been investing in multiple aspects of data capture and sharing:

To improve the reliability of access to its data warehouse, in 1987, Walmart built the world’s largest private satellite communications system.

in 1991, Walmart spent $4 billion to create their new data warehouse Retail Link .

Walmart was a driving force in the development of a business support system called Collaborative Planning, Forecasting, and Replenishment (CPFR). This software system can be used by supply chain partners to make coordinated business plans.

Slide17

17

The business world is rapidly moving forward on data issues;

Radio frequency identification (RFID) can be even more cost effective. RFID enables the automated capture of data transmitted by radio waves from tags placed on shipping containers and product items.

No physical contact or line of sight between a tag and tag reader are required, and multiple tags can be read at once.

Slide18

18

A globally accepted set of Electronic Product Codes (EPCs) is also needed

The business world product code development seems to be going forward with little involvement of the official statistics community.Slide19

19

“If the product is the same but the supplier is different, do we continue to price it as the same item? What if, in fact, the buyer uses multiple suppliers? Do we select a specific supplier or use some sort of average?” William Alterman

“Perhaps the BLS should use an altogether different approach, such as combining prices from different respondents (in cases where the item specifications are identical).

William Alterman

Slide20

20

We agree with Alterman!

Our agreement is clear from the fact that it is unit values and total quantities that are inserted into the “true” target index in our 2010 paper.

Our paper fleshes out more fully why these proposed changes would be effective.