/
Meditation or Exercise to Prevent 	        Acute Respirator Meditation or Exercise to Prevent 	        Acute Respirator

Meditation or Exercise to Prevent Acute Respirator - PowerPoint Presentation

faustina-dinatale
faustina-dinatale . @faustina-dinatale
Follow
445 views
Uploaded On 2016-03-04

Meditation or Exercise to Prevent Acute Respirator - PPT Presentation

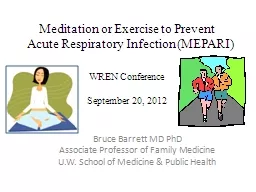
Bruce Barrett MD PhD Associate Professor of Family Medicine UW School of Medicine amp Public Health WREN Conference September 20 2012 Cold and Flu Acute Respiratory Infection ID: 242017

respiratory ari exercise amp ari respiratory amp exercise illness cold mindfulness severity influenza health stress meditation medicine phd flu

Share:

Link:

Embed:

Download Presentation from below link

Download Presentation The PPT/PDF document "Meditation or Exercise to Prevent ..." is the property of its rightful owner. Permission is granted to download and print the materials on this web site for personal, non-commercial use only, and to display it on your personal computer provided you do not modify the materials and that you retain all copyright notices contained in the materials. By downloading content from our website, you accept the terms of this agreement.


Presentation Transcript

Slide1

Meditation or Exercise to Prevent Acute Respiratory Infection (MEPARI)

Bruce Barrett MD PhDAssociate Professor of Family MedicineU.W. School of Medicine & Public Health

WREN ConferenceSeptember 20, 2012Slide2

(Cold and Flu)

Acute Respiratory Infection?

Can we preventResearch Question:Slide3

Mindfulness meditation may reduce stress, & thereby prevent or ameliorate cold-n-flu

http://theantiagingspecialist.com/destructive-stress-and-aging

HYPOTHSIS#1Slide4

http://technorati.com/lifestyle/article/running-to-lose-weight/

Exercise may stimulate the immune system, and thereby prevent or ameliorate cold-n-flu

HYPOTHSIS#2Slide5

Acute respiratory infection = ARIInfluenza ARI is associated with ≥ 30,000 deaths and 500,000 hospitalizations in the U.S yearly

Non-influenza ARI accounts for ≥ 20 million doctor visits and 40 million lost school/work daysEconomic impact of non-influenza ARI ≥ $40 billion, making non-influenza ARI one of the top 10 most expensive illnesses

A. E. Fiore et al. Prevention and control of influenza with vaccines: recommendations of the Advisory Committee on Immunization Practices (ACIP), 2010. MMWR Recomm.Rep. 59 (RR-8):1-62, 2010. N. A. Molinari, et al. The annual impact of seasonal influenza in the US: measuring disease burden and costs. Vaccine 25 (27):5086-5096, 2007.A. M. Fendrick, A. S. Monto, B.

Nightengale, and M. Sarnes. The economic burden of non-influenza-related viral respiratory tract infection in the United States. Archives of Internal Medicine. 163 (4):487-494, 2003.Slide6

A

. S. Monto. Epidemiology of viral respiratory infections. American Journal of Medicine.

112:Suppl-12S, 2002.Metapneumovirus reported 2004, Bocavirus

in 2006

J. V. Williams et al. Human

metapneumovirus

and lower respiratory tract disease in otherwise healthy infants and children.

New England Journal of Medicine. 350 (5):443-450, 2004.

T. P.

Sloots

,

etal

. Evidence of human

coronavirus

HKU1 and human

bocavirus

in Australian children.

J.Clin.Virol

. 35 (1):99-102, 2006.Slide7

A. S. Monto. Epidemiology of viral respiratory infections.

American Journal of Medicine.

112:Suppl-12S, 2002.Slide8
Slide9

Flu shots prevent flu – SomewhatSeasonal influenza vaccination is generally accepted as cost-effective for preventing influenza illness

Seroprotection rates range from 60-80% in healthy younger adults to 40-60% in the elderlyActual preventive effectiveness is probably lower  

AC Voordouw et al. Annual revaccination against influenza and mortality risk in community-dwelling elderly persons. JAMA 2004;292:2089-95.Advisory Committee on Immunization Practices CfDCaP. Prevention and control of influenza. Recommendations of the Advisory Committee on Immunization Practices (ACIP).

MMWR Morb Mortal Wkly Rep 2006;55:1-41.M. J.

Postma

, et al.

Pharmacoeconomics

of influenza vaccination in the elderly: reviewing the available evidence.

Drugs & Aging 17 (3):217-227, 2000.

Slide10

Q. Can we prevent non-influenza ARI?A: Maybe, sometimes, don’t know

Contact avoidanceHand-washing

Enhance physical healthExerciseNutritionEnhance mental healthStress reductionSelf-care

Relationships

Immunization is impractical because too many viruses

Immune enhancing drugs, herbs (

echinacea

) and supplements (vitamins) are unprovenSlide11

Stress & immunity to colds & fluStressed people have more frequent and more severe cold and flu illness episodesStress negatively influences several immune system processes

S. Cohen et al. Psychological stress, cytokine production, and severity of upper respiratory illness.

Psychosomatic Medicine 61 (2):175-180, 1999.E. Fondell et al. Physical activity, stress, and self-reported upper respiratory tract infection. Med.Sci.Sports

Exerc

. 43 (2):272-279, 2011.

N. P. Walsh, et al. Position statement. Part two: Maintaining immune health.

Exerc.Immunol.Rev

. 17:64-103, 2011.Slide12

Stress hits at multiple levels

http://ecohealthwellness.comSlide13

Mindfulness based stress reduction

Pioneered by Jon Kabat-Zinn PhD

Center for Mindfulness in Medicine, Health CareUniversity of Massachusetts Medical School Standardized 8 week courseIncorporates aspects of meditation & yogaAims to enhance awareness of body & mind

Attention to sensation, thought, emotions2.5 hours in class each week45 minutes daily practice

MBSRSlide14

Mindfulness training reduces stressReasonable evidence exists suggesting that MBSR training can reduce self-reported stress and other negative emotionsNot much evidence regarding actual illness

Carmody J,.Baer RA. Relationships between mindfulness practice and levels of mindfulness, medical and psychological symptoms and well-being in a mindfulness-based stress reduction program. J.Behav.Med.

2008;31:23-33.Mars TS,.Abbey H. Mindfulness meditation practise as a healthcare intervention: A systematic review. International Journal of Osteopathic Medicine 2010;13:56-66.Slide15

Regular exercise may prevent ARIObservational and experimental studies suggest that regular exercise may protect people from ARI illness. [1]

The largest RCT (n=115; 1-year f/u), designed for other purposes, reduced chance of ARI from 48% to 30% (p=0.03) [2]An observational cohort study (n=1002) reported 32 to 46% lower incidence, duration and severity of ARI illness among most active vs. least active people [3]

1. S.A. Martin, B.Pence

, and J. Woods. Exercise and respiratory tract viral infections.

Exerc.Sport

Sci.Rev

. 37 (4):157-164, 2009.

2. J.

Chubak

et al

. Moderate-intensity exercise reduces the incidence of colds among postmenopausal women.

Am J Med

2006;

119

:937-42.

3. D.C.

Nieman

et al

.

Upper respiratory tract infection is

r

educed in physically fit and active adults.

Br.J.Sports

Med.

2010.Slide16

“Ergo, sufficient evidence exists to justify formal testing of the hypotheses that training in meditation or exercise might reduce incidence, duration and severity of ARI illness”Slide17

MEPARI trialMeditation orExercise to

PreventAcuteRespiratoryInfectionSlide18

MEPARI

OBJECTIVETo

evaluate potential preventive effects of mindfulness meditation or sustained moderate intensity exercise on incidence, duration and severity of acute respiratory infection

Department

of

Family MedicineSlide19

MEPARI = randomized controlled trialCommunity recruited adults aged 50 years or older were randomized to 1 of 3 conditions:

8-week training in mindfulness meditation

matched 8-week training in moderate intensity sustained exercisewait-list observational controlSlide20

Mindfulness based stress reduction

Pioneered by Jon Kabat-Zinn PhD

Center for Mindfulness in Medicine, Health CareUniversity of Massachusetts Medical School Standardized 8 week courseIncorporates aspects of meditation & yogaAims to enhance awareness of body & mind

Attention to sensation, thought, emotions2.5 hours in class each week45 minutes daily practice

MBSRSlide21

ExerciseDuration (8 weeks)Attention (weekly 2½ hour group sessions)

Intensity (daily 45 minute at-home practice)Location (UW Research Park)

Aimed at sustained moderate intensity exerciseJogging, fast walking, biking, swimming, etcGoal of 12 to16 points on Borg’s Rating of Perceived Exertion

Matched to MBSR by:

Borg

GV,.Linderholm

H. Perceived exertion and pulse rate during graded exercise in various age groups.

Acta

Medica

Scandinavica

1967;

472

:194-206Slide22

Randomized using statistical algorithmSlide23

Sampling frameworkInclusion

age ≥ 50 yearswillingness to do any of the 3 randomized assignmentsself-report either ≥ 2 colds in the last 12 months or an average of ≥ 1 cold per yearability to complete protocol, including short run-in trial

Exclusionprevious training or current practice in meditationmoderate exercise ≥ 2X/week or vigorous exercise ≥ 1X/wkimmunodeficiency, immunoactive drugs, autoimmune or malignant ds.contraindication to flu shot

Recruitment

via community advertising with telephone screening and in-person informed consent and enrollmentSlide24

Human subjects monitoringI.R.B. - University of Wisconsin Institutional Review Board Human Subjects CommitteeD.S.M.C. - Data and Safety Monitoring Committee

No specific potential adverse outcomes were designated for monitoringSlide25

2-week Run-in Trial2 phone contacts1 set of homework questionnaires

2 in-person appointments, consisting of: a) consent and instructions for run-in b) exit of run-in and consent for main trial Slide26

ARI illness definedBeginning of ARI illness is when participant first answers “Yes” to either: “Do you think you are coming down with a cold?” OR “Do you think that you have a cold?” AND

Must have ≥ 1 of: nasal congestion, nasal discharge, sneezing, or sore throat AND ≥ 2 points on the Jackson scale* ANDBoth participant and research assistant say it’s not allergy ANDSymptoms must last at least 2 days in a row

Last moment of ARI illness episode is defined as when participant last rates their ARI illness severity above zero using “How sick do you feel today?” AND repeats the subsequent “Not sick” assessment for 2 days in rowG.G. Jackson, H. F. Dowling, and R. L. Muldoon. Present concepts of the common cold. Am J Public Health 52 (6):940-945, 1962Slide27

ARI illness assessedDuration of ARI illness episode assessed in hours and minutes, then converted to decimalized days

During ARI illness episode each participant fills out WURSS-24 instrument every dayItems summed to give daily severity score (Y axis)Primary outcome

of global severity defined as area under the time severity curve (AUC)Trapezoidal approximation used to calculate AUCB. Barrett, et al. Validation of a short form Wisconsin Upper Respiratory Symptom Survey (WURSS-21). Health and Quality of Life Outcomes 7 (76), 2009Slide28

Do not have

this symptom

Very mild

Mild

Moderate Severe

0

1

2

3

4

5

6

7

Runny nose

O

O

O

O

O

O

O

O

Plugged nose

O

O

O

O

O

O

O

O

Sneezing

O

O

O

O

O

O

O

O

Sore throat

O

O

O

O

O

O

O

O

Scratchy throat

O

O

O

O

O

O

O

O

Cough

O

O

O

O

O

O

O

O

Hoarseness

O

O

O

O

O

O

O

O

Head congestion

O

O

O

O

O

O

O

O

Chest congestion

O

O

O

O

O

O

O

O

Feeling tired

O

O

O

O

O

OOOHeadacheOOOOOOOOBody achesOOOOOOOOFeverOOOOOOOO

: Over the last 24 hours, how much has your cold interfered with your ability to:

Notat allVerymildlyMildly Moderately Severely01 234567Think clearlyOOOOOOOOSleep wellOOOOOOOOBreathe easilyOOOOOOOOWalk, climb stairs, exerciseOOOOOOOOAccomplish daily activitiesOOOOOOOOWork outside the homeOOOOOOOOWork inside the homeOOOOOOOOInteract with othersOOOOOOOOLive your personal lifeOOOOOOOO

Please rate the average severity of your cold symptoms over the last 24 hours for each symptom:

WURSS 21Slide29

WURSS has been “validated”B. Barrett, R. Brown, and M. Mundt

. Comparison of anchor-based and distributional approaches in estimating important difference in common cold. Quality of Life Research 17 (1):75-85, 2008.B. Barrett, R. Brown, R.

Voland, R. Maberry, and R. Turner. Relations among questionnaire and laboratory measures of rhinovirus infection.

European Respiratory Journal 28 (2):358-363, 2006.

B. Barrett, et al. The Wisconsin Upper Respiratory Symptom Survey: Development of an instrument to measure the common cold.

Journal of Family Practice 51 (3):265-273, 2002.

B. Barrett, et al. The Wisconsin Upper Respiratory Symptom Survey is responsive, reliable, and valid.

Journal of Clinical Epidemiology 58 (6):609-617, 2005.

B. Barrett, et al.. Validation of a short form Wisconsin Upper Respiratory Symptom Survey (WURSS-21).

Health and Quality of Life Outcomes 7 (76), 2009.Slide30

Hypothesis-testing & PowerFrom the NIH-accepted protocol:“Null hypotheses will be rejected if interventions are superior to control at a p ≤ 0.025, using one-sided alternative testing.”

“Power calculations are based on 2-way contrasts between: 1) meditation vs. control and 2) exercise vs. control.”“One-sided testing is supported by previous published research, which is overwhelmingly in the direction of positive results.”

Decisions vetted by several statisticians & methodologists at the University of Wisconsin and at NIHSlide31

Because of limited power, MEPARI best described as preliminary trial (phase 2?)Slide32

Biweekly phone monitoringParticipants given Jackson and WURSS questionnaires at enrollment and were reminded with each study contact to begin documenting ARI symptoms as soon as they felt they might be getting a cold

Contacted by phone every 2 weeks if they had not called inAs soon as ARI criteria met, arrangements made for lab visit to collect nasal wash specimenSlide33

Biomarkers of ARI illnessNasal wash specimens analyzed for:Viral nucleic acid using multiplex PCR

Neutrophils (cell count per high power field) considered marker of nasal inflammationInterleukin-8 (pg/

mL). IL-8 is cytokine considered as marker of immune responseLee WM, et al. High-throughput, sensitive, and accurate multiplex PCR-microsphere flow cytometry system for large-scale comprehensive detection of respiratory viruses. J.Clin.Microbiol.

2007;45:2626-34ELISA - Human IL-8 BD OptEIA Set, BD Biosciences

Pharmingen

, San Diego, CA Slide34

NIH NCCAM ARRA fundingNational Center for Complementary & Alternative Medicine (NCCAM)National Institutes of Health (NIH)

American Recovery & Reinvestment Act (ARRA) of 2009 “Economic Stimulus” fundingOriginal proposal was for 4 to 5 year projectARRA required data collection over 1 year, and full project finished within 2 years

Aimed for Employment as well as ScienceMedical research “soft money” = New jobsSlide35

Many people involved in MEPARIShari Barlow

, Michele Gassman

, Lori Wilson, Kati Krome

, Tola

Ewers

Chidi

Obasi

MD MSPH, Becky West PhD APRN, also several undergrad students

Exercise & Mindfulness trainers/coordinators

Nursing & Lab personnel at UW Hospitals

Grant management, Personnel, UW support

Principal Investigator: Bruce Barrett MD PhD, Co-Investigators: Chris Coe PhD, Mary

Hayney

PharmD

, Dave

Rakel

MD, Daniel Muller MD PhD, Roger Brown PhD,

Zhengjun

Zhang PhD, Ann Ward PhD, Aleksandra

Zgierska

MD PhD,

James

Gern

MD

, Richard Davidson PhDSlide36

2009-2010 cold/flu season

ARRA required data collection take no more than 1 year

Logistical limitations required two cohorts:Cohort 1 – September to May

Cohort 2 – January to MaySlide37
Slide38
Slide39

Exercise

Meditation

# Control

P-value

Sample (n)

Ex47E

vbg51

f51

Exercise

Mindfulness

Control

p-value

Age (years)

mean

(SD)

59.0 (6.6)

60.0 (6.5)

58.8 (6.8)

0.63

Female n (%)

39 (83.0)

42 (82.4)

41 (80.4)

0.94

Non smokers n (%)

43 (91.5)

48 (94.1)

48 (94.1)

0.84

Race

φ

Black n (%)

3 (6.4)

1(1.9)

2 (3.9)

0.52

White n (%)

43 (91.5)

49 (

92.5

)

48 (94.1)

0.88

Other n (%)

1 (2.13)

3(5.7)

1 (2.0)

0.50

Ethnicity

Non-Hispanic

n

(%)

47 (100)

51 (100)

49 (96.1)

0.14

BMI mean (SD)

29.0 (6.9)

29.0 (6.0)

29.8 (6.8)

0.77

Participant Characteristics of N=149 MEPARI trial finishersSlide40

Error bars represent 95% confidence intervals

Figure 2 - MEPARI Trial Main ResultsSlide41

MEPARI Main Outcomes

P-values come from unadjusted intervention-to-control contrasts, using

2 sample T-test for continuous means (SAS 9.2; SAS Institute, Carey, NC, USA) and proportional difference for binomials (StatXact-5 Cytel Software Corporation).Slide42

Zero-inflated Poisson regressionPeople can have or not have ARI episodes (binomial; logistic)

ARI episodes vary in duration & severity (continuous; linear)Zero-inflated models (ZIM) are a mixed model approach taking into account both frequency and magnitude of ARI illnessEach primary contrast (MM

vs CTL and EX vs CTL) is tested within a ZIM model for each main outcome (duration, severity)Adjusting for pre-specified covariates, both total days of illness (p=0.033) and global severity (p=0.010) appeared lower for meditation, but not for exercise (p=0.47 and 0.31, respectively)Slide43

Count Predictors (Linear sub-model)

Predictors of excess zero

(Logistic sub-model)

Estimate(S.E)

P-value

Estimate(S.E

)

P-value

Group 1

0.83(0.45)

0.032

Group

1 EX

-0.16(0.32)

0.31

Group

2 MM

-0.74(0.32)

0.010*

Group 2

0.60(0.42)

0.079

Cohort

-0.46(0.26)

0.040

Cohort

0.16(0.40)

0.34

AGE

0.026(0.025)

0.15

AGE

0.05(0.028)

0.038

Smoking status

-0.028(0.34)

0.47

Smoking status

-2.51(1.1)

0.012*

Education

-0.038(0.15)

0.40

Education

-0.041(0.21)

0.42

BMI

0.025(0.024)

0.15

BMI

-0.038(0.031)

0.11

SF-12 Physical

-0.021(0.016)

0.097

SF-12 Physical

0.018(0.024)

0.23

SF-12 Mental

0.004(0.019)

0.42

SF-12 Mental

0.015(0.029)

0.31

Gender

-0.003(0.26)

0.5

Gender

0.062(0.45)

0.45

Intercept

Intercept

AUCT

5.51(2.27)

0.008

AUCT#1

-3.76(3.36)

0.13

Zero-inflated Poisson regression model for Global severity (AUC)Slide44

Count Predictors (Linear sub-model)

Predictors

of excess

zero

(Logistic sub-model)

Estimate(S.E

)

P-value

Estimate(S.E

)

P-value

Group 1

EX

-0.013(0.20)

0.47

Group 1

MM

0.82(0.45)

0.034

Group 2

MM

-0.43(0.23)

0.033

Group 2

EX

0.50(0.42)

0.12

Cohort

-0.26(0.20)

0.10

Cohort

0.084(0.39)

0.42

Age

0.013(0.017)

0.22

Age

0.049(0.028)

0.041

Smoking status

-0.35(0.22)

0.059

Smoking status

-2.53(1.11)

0.011*

Education

0.023(0.10)

0.41

Education

-0.087(0.21)

0.34

BMI

0.010(0.014)

0.24

BMI

-0.038(0.031)

0.11

SF-12 Physical

-0.004(0.012)

0.37

SF-12 Physical

0.015(0.024)

0.26

SF-12 Mental

0.007(0.013)

0.30

SF-12 Mental

0.016(0.029)

0.29

Gender

-0.023(0.18)

0.45

Gender

0.021(0.45)

0.48

Intercept

Intercept

TOTDAYS

1.71(1.81)

0.17

TOTDAYS#1

-3.24(3.34)

0.17

Zero-inflated Poisson regression model for Duration (total days of ARI)Slide45
Slide46

MEPARI Secondary OutcomesSlide47

Exercise

Meditation

Control

Exercise

9 weeks

3 months

9 weeks

3 months

9 weeks

3 months

Met Minutes/week

**2222

(1815, 2628)

**1805

(1356, 2253)

1037

(694, 1381)

1122

(804, 1440)

1224

(810, 1638)

1050

(688, 1412)

Mindfulness

4.59 (4.36, 4.82)

4.82 (4.59, 5.05)

4.55 (4.37, 4.73)

4.73 (4.54, 4.91)

4.60 (4.40, 4.81)

4.59 (4.37, 4.82)

Indicators of good health

- positive change indicates improvement

Physical Health

51.8 (49.3, 54.2)

52.0 (49.4, 54.6)

49.8 (47.2, 52.3)

50.5 (48.0, 53.1)

51.1 (48.5, 53.6)

50.6 (47.8, 53.6)

Mental health

*53.0 (50.9, 55.1)

49.7 (46.7, 52.7)

*52.6 (50.5, 54.7)

*50.5 (48.1, 53.0)

49.0 (46.4, 51.5)

46.3 (43.5, 49.0)

Social Support

43.4 (41.1, 45.7)

43.6 (41.3, 45.9)

42.4 (39.8, 44.9)

44.5 (42.4, 46.5)

44.0 (42.1, 45.9)

44.0 (42.1, 46.0)

Indicators of poor health -

negative change indicates improvement

Perceived Stress

9.5 (7.8, 11.2)

10.0 (8.2, 11.7)

11.2 (9.7, 12.8)

11.4 (9.5, 13.4)

10.5 (8.6, 12.3)

11.4 (9.5, 13.2)

Negative emotion

14.0 (12.8, 15.2)

14.4 (13.1, 15.7)

15.0 (13.7, 16.2)

15.0 (13.3, 16.7)

14.6 (13.3, 15.9)

14.9 (13.8, 16.0)

Anxiety

30.2 (27.6, 32.8)

29.1 (26.6, 31.7)

30.7 (28.0, 33.4)

29.7 (26.9, 32.5)

31.2 (28.4, 33.9)

30.4 (27.9, 32.9)

* p-value <0.05 and **p<0.01 for comparison of intervention means vs. control means at each time periodSlide48

LimitationsFirst trial of its kindUnderpoweredParticipants not blinded to interventionOutcomes mostly self-reportedLogistics required 2 cohorts of differing lengthsNo clear mechanistic pathwaysSlide49

Immune system

http://www.microbiologybytes.comHighly complex

Widely distributed“Innate” immunity poorly understood(Adaptive immunity better understood) Slide50

Conclusions:Mind-body behavioral trainings such as mindfulness meditation or moderate intensity sustained exercise may reduce incidence, duration and severity of cold/flu illness

If these results are confirmed in future studies there may be important implications for both:

1) health-related policy & practice, and 2) scientific understanding of mechanisms of health maintenance and disease preventionSlide51

technorati.com/lifestyle/article/running-to-lose-weight

theantiagingspecialist.com/destructive-stress-and-aging

http://