/
Particulars  %age growth Particulars  %age growth

Particulars %age growth - PowerPoint Presentation

faustina-dinatale
faustina-dinatale . @faustina-dinatale
Follow
373 views
Uploaded On 2018-03-20

Particulars %age growth - PPT Presentation

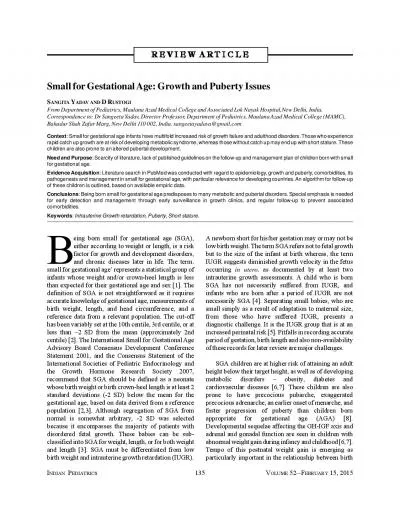
Global Deposits 3008 Global Advances 2718 CASA Deposits 1590 Operating Profit 1939 Net Profit 898 Net Interest Income 1886 NonInterest Income 2642 HIGHLIGHTS AS ON DEC13 9M ID: 658194

crore dec total amp dec crore amp total 2013 growth domestic 13dec interest npa income restructured net advances bank

Share:

Link:

Embed:

Download Presentation from below link

Download Presentation The PPT/PDF document "Particulars %age growth" is the property of its rightful owner. Permission is granted to download and print the materials on this web site for personal, non-commercial use only, and to display it on your personal computer provided you do not modify the materials and that you retain all copyright notices contained in the materials. By downloading content from our website, you accept the terms of this agreement.


Presentation Transcript

Slide1
Slide2

Particulars

%age growth

Global Deposits

30.08%

Global Advances

27.18%CASA Deposits15.90%Operating Profit19.39%Net Profit8.98%Net Interest Income 18.86%Non-Interest Income26.42%

HIGHLIGHTS AS ON DEC-13 (9M)

2

Gross NPA

Ratio

2.81%

Net NPA

Ratio

1.75

%

Provision

Coverage Ratio

63.77%

Standard Restructured Portfolio

6.14% Slide3

Global Business reached

`

810,687

Crore (YoY Growth 28.79%)

Global

Deposits ` 454140Crore (YoY Growth 30.08%)Global Advances at ` 356547Crore (YoY Growth 27.18%)CASA Deposit at ` 101957 Crore (YoY Growth 15.90%)Operating Profit (Q3) increased from ` 1856 Crore in Dec.-12 to ` 2144 Crore in Dec-13 ( YoY growth 15.52%)Net Profit (9 months) increased from Rs.1993 Crore in Dec-12 to Rs.2172 Crore in Dec-13 (Growth 8.98%). Net Profit for Dec-13 (Qtr) stood at Rs.586 Crore.Gross NPA Ratio improves from 2.93 % in Sept., 2013 to 2.81 % in Dec- 2013.Net NPA ratio improves from 1.85 % in Sept., 2013 to 1.75 % in Dec- 2013.Provision Coverage Ratio improves from 60.74% in Dec-12 and 63.29 % in Sep-2013 to 63.77 % in Dec-13Standard Restructured Portfolio as %age of Advances decreased from 6.88% in Sep-13 to 6.14% in Dec-13.Net Interest Income (Q3) increased from ` 2308 Crore in Dec-12 to ` 2719 Crore in Dec-13 (YoY Growth 17.81%)Non Interest Income increased from ` 937 Crore in Dec-12 to ` 1097 Crore in Dec-13 (YoY Growth 17.08%)No. of Domestic branches increased from 4292 March-13 to 4522 in Dec-13No. of ATMs increased from 2133 March-13 to 3362 in Dec-133

Business

Performance: Dec-2013Slide4

4

Business Mix

Dec-12

March-13

June-13

Sep-13Dec-13Growth % Y-o-YDomestic457,156498,103524,995555,00757511725.80Foreign172,317176,705199,401214,09823557036.71Global629,473674,808724,396769,10581068728.79( ` in Crore)

Business Growth- SequentialSlide5

5

(

`

in

Crore)Dec-12Mar-13June-13Sep-13 Dec-13Growth % Y-o-YDomestic268,176294,067316,112322,19333971426.68Foreign80,94187,77398,852110,08911442641.37Global349,117381,840414,964

432,282454140

30.08

Deposits- SequentialSlide6

6

(

`

in

Crore)Savings Deposit Annual Growth: 14.08%CASA Annual Growth: 15.90%CASA Growth- SequentialCASA % (Aggregate Deposits)Sep-13: 30.44%Dec-13 : 30.99%Slide7

Bulk Deposits

Dec

– 12

Mar - 13

Dec -13

% of Domestic DepositsBulk deposits 40,96827,17319,6675.79Certificate of Deposits9,47011,99710,2613.02Total50,43839,17029,9288.81( ` in Crore)7Slide8

FCNR & NRE Deposits

Parameter

Dec – 12

Mar - 13

June-13

Sep-13Dec-13Growth % Y-o-YFCNR (B)5,2405,3106,02610,05617,564235.19NRE8,7859,52610,46911,46411,71033.30NRE SB 1,9051,8212,0242,0762,0527.72

NRE TD 6,880

7,7058,445

9,388

9,658

40.38

NRO

1,912

1,852

1,847

1,883

1,877-1.83

(

`

in

Crore)

8Slide9

9

(

`

in

Crore)Dec-12Mar-13June-13Sep-13Dec-13Growth % Y-o-YDomestic188,980204,036208,883232,815235,40324.57Foreign91,37688,932100,549104,009121,14432.58Global280,356292,968309,432

336,824356,547

27.18

Gross Advances-SequentialSlide10

CD

Ratio

Dec-12

Mar - 13

Dec-13

Domestic70.4669.3869.29International112.88101.32105.87Global80.3076.7378.51( ` in Crore)10Slide11

11

(

`

in

Crore)Dec -12March-13Dec-13% Growth Y-o-YAgriculture24,94927,04132,38729.81MSME (Priority & Non Priority) 32,56137,23039,73522.03Retail Credit20,91422,35025,52722.06Corporate110,556117,415137,75424.60Total188,980

204,036235,403

24.57Total Export Credit

8,813

9,53110,498

19.12

Key Sectors (Domestic Credit)Slide12

12

(

`

in

Crore)Priority SectorIndustryDec-12Mar-13Dec-13% Growth Y-o-Y%age to ANBCAgriculture24,94927,04132,38729.8115.97MSE25,86728,91330,87819.37Housing Loan6,0806,7907,23018.91Educational Loan2,428

2,3292,5595.40

Others

383

346343

-10.44

Total Priority Sector Advances

59,70765,518

73,397

22.9336.19Slide13

13

(

`

in

Crore)ParticularsDec-12March-13Dec-13% Y-o-Y %age to Domestic CreditHome Loan9,55710,26712,07226.325.13Mortgage Loan1,7072,0082,57050.561.09Auto Loan1,9392,0372,28317.740.97Education Loan2,4292,4112,6147.62

1.11Personal Loan 727

779856

17.74

0.36Others

4,5554848

5,132

12.672.18

Total

20,91422,350

25,527

22.0610.84

Retail CreditSlide14

Particulars

Dec-12

Mar-13

Dec-13

%age

Y-o-Y %age to Domestic Advances %age NPA to sector wise advances Textiles8,3968,8829,83517.144.1813.96Chemicals & Chemical products4,9315,1106,42430.282.735.11Rubber, Plastic & their products2,4982,5492,7008.091.156.85Basic metal & metal products13,32413,69913,8433.905.889.17

Vehicles, vehicle parts & Transport equipment2,114

2,0522,190

3.60

0.936.58

Gems & Jewellery

4,5324,605

5,592

23.392.38

6.31Construction

1,482

1,7701,900

28.21

0.811.58

Infrastructure

31,50933,495

37,995

20.58

16.14

1.34

Other Industries22,023

23,288

25,546

16.00

10.85

6.54

Total

90,809

95,450

1,06,025

16.76

45.04

5.53

.

(

`

in

Crore)

Key Sector- Domestic Credit- Industry

14Slide15

Advances to Infrastructure Sector

Particulars

Dec-12

March-13

Dec-13

Power21,073(11.15%)22,270(10.91%)23,681(10.06%)Out of which: a. State Electricity Boards (SEBs)8,8398,90710,408 b. Others12,23413,36313,273Telecommunication1,4301,4271,383Roads & Ports6,5887,1749,507Others2,4182,6243,424

Total31,509

33,49537,995

15

(

`

in

Crore)

Figures in Bracket () denote the % to domestic advancesSlide16

Domestic

Foreign

Global

> 1

Cr

< 1 CrTotal AmountAmountAmountAs on 31.03.20132062579821423242923852Additions during Q1627128 7559764Add/Less :-(-)Repayment in Restructured a/cs(+)Increase in O/S balance in Restructure a/cs330 645 37 4 367 649 15280 382929As on 30.06.20132156689422460 2703 25163Additions during Q2750105 855- 855Add/Less :-(-)Closures/Repayment in Restructured a/cs(+)Increase in O/S balance in Restructure a/cs1318721 374 1355 725104420*14591145As on 30.09.20132172196522686301925705

Movement of Restructured Assets

(

`

in Crore)

16Slide17

Restructured Accounts (Contd..)

(Includes all facilities of the borrowers)

Domestic

Foreign

Global

> 1 Cr< 1 CrTotal AmountAmountAmountAs on 30.09.20132172196522686301925705Additions during Q31029117114651516616Add/Less :-(-)Closures/Repayment in Restructured a/cs(+)Increase in O/S balance in Restructureda/cs21846454272226652113362339688As on 31.12.201321212104722259345725716( ` in Crore)

17Slide18

18

(

`

in

Crore)Standard Restructured Advances as on 31.12.2013 as per RBI GuidelinesParticularsDec-13% to AdvancesDomestic14,4666.14Foreign1,9281.59Total16,3944.60Slide19

Restructured Assets (Domestic) – Quarter-wise

19

(

`

in Crore)Quarter ended Amount RestructuredDecember, 20121,996.18March, 20132297.00June, 2013755.18September, 2013855.25December, 20131146.30Slide20

Segment-wise Standard Restructured Assets

as

on

31.12.2013

(

` in Crore)20Domestic ForeignGlobalCDR Restructuring4,2101474,357SME Debt Restructuring645-645Other Restructuring9,611178111,392Total14,466192816,394Slide21

21

Sector wise breakup of Standard Restructured Advances (Domestic)

SECTOR

AMOUNT

INFRA

4,427AVIATION2,435TEXTILES1,016STEEL1,006HOTELS710ENGINEERING831COMPUTER/IT RELATED520SUGAR286EDUCATION266PHARMACEUTICALS149OTHER METALS120CONSTRUCTION-PAPER & PAPER PRODUCTION78CHEMICALS161AGRI136TRADE51

CRE286SERVICES

10

AUTOMOBILES255

MISC **

1,724GRAND TOTAL

14,466

(

`

in

Crore)Slide22

22

(

`

in

Crore)Dec-12Mar-13June-13Sep-13Dec-13Gross NPA8,6258,7659,4149,88010,023Net NPA5,4555,9476,4096,1566,147Gross NPA %3.082.993.042.932.81Net NPA %1.972.062.101.851.75Provision Coverage Ratio %60.7460.9260.9763.2963.77

NPA RatiosSlide23

(

`

in

Crore)

Movement of NPA (9 months ended)(01.04.2013 to 31.12.2013) Dec. 2012Dec 2013 IndianForeignTotalIndianForeignTotalOpening Balance51707245894715216138765Add : Slippages49257775702

4763440

5203 Total

10095

150111596

11915

2053

13968

Less :970

44

1014

1773

351798

Recovery

Upgradation

710

33

743

738

163

901

Write Off

1128

2

1130

663

635

1298

Total reduction

2808

79

2887

3174

823

3997

Less URI

76

8

84

-50

-3

-53

Closing Balance

7211

1414

8625

8790

1233

10023

23Slide24

Sale of Assets to

ARCs

Mar-13

Mar-14

FY

Q1Q2Q3No. of Accounts Sold--162,12,342Aggregate Outstanding of Accounts sold--3131744Of which Written of Assets sold--127722Existing Gross NPAs sold(NPAs before 31.03.13)--143428Current Year NPAs sold and adjusted from Slippages (NPAs After 01.04.13)--43594( ` in Crore)24Slide25

Sector-wise breakup of NPA (Domestic)

Sector

Mar-13

June-13

Sep-13

Dec-13Dec-13 % to Total AdvancesAgriculture6137377445330.23Industry4,4464,9725,2355,8642.49Services1,8482,2302,4972,1730.92Retail2443042982200.09 Total7,1518,2438,7748,7903.73

(

`

in Crore)

25Slide26

Industry-wise breakup of NPA (Domestic)

INDUSTRY

Mar-13

June-13

Sep-13

DEC'13 Dec-13 % to Total NPADec-13% to Total AdvancesMining and Quarrying8170701382.350.06Food Processing2732973174567.780.19Beverage & Tobacco7191580.140.00Textile138815651684137323.410.58Leather

404144

380.65

0.02Wood

8

971

80.14

0.00Paper

23109

116

1512.58

0.06Petroleum

6868

69

2073.53

0.09Chemical

488

409

389

328

5.590.14Rubber Plastics

53

113

187

185

3.15

0.08

Glass & Glassware

1

30

30

29

0.49

0.01

Cement & Cement Products

19

21

26

81

1.38

0.03

Basic Metal

1110

1270

1107

1270

21.66

0.54

All Eng

88

90

142

143

2.44

0.06

Vehicle & vehicle part

12

12

15

144

2.46

0.06

Gems & Jewellry

82

95

114

353

6.02

0.15

Construction

21

20

35

30

0.51

0.01

Infrastructure

329

340

338

511

8.71

0.22

Others

355

394

469

411

7.01

0.17

TOTAL

4446

4972

5235

5864

100.00

2.49

(

`

in

Crore)

26Slide27

Major Slippages during the Quarter(Domestic)

INDUSTRY

Qtr Mar-13

Qtr June-13

Qtr Sep-13

Qtr Dec-13 Mining3.45.72.276Food processing5.420.39.3222Beverage & Tobacco0.50.44.30Textile824.5227.9208110Leather001.92Wood00.565.42Paper6.892.84.143Petroleum41.500112Chemical

111.437.260.9

55Rubber Plastics23.8

43.152.1

13Glass & Glassware0

29.40.7

0Cement & Cement Products

00.71

56Basic Metal

275.367.7

36.7289All Engineering

11.8

54.185

Vehicle & vehicle part3.2

0.90134

Gems & Jewellery0

12.9

305

11

Construction0.6

1.68.7

16Infrastructure

0

16.5282.3

152

Others

119.7

12.7

20.7

13

(

`

in

Crore)

27Slide28

Net Interest Income

Particulars

Quarter ended

Variation

Y-o-Y %

Nine Months endedVariationY-o-Y %Dec-12Dec-13Dec-12Dec-13Interest Income8,023976921.7623,73727,55016.06a. From Advances5,791701721.1717,21319,83915.26b. From Investments1,809220722.005,5416,220

12.25c. Other Interest Income

423545

28.84

983

1,491

51.68Interest Expended

5,7147050

23.38

17,189

19,767

15.00a. On Deposits

5,0856089

19.74

15,115

17,455

15.48

b. On Borrowings

338

580

71.60

1,205

1,260

4.56

c. Subordinated Bonds

168

218

29.76

502

554

10.36

d. Others

123

163

32.52

368

498

35.33

Net Interest

Income

2,308

2719

17.81

6,548

7,783

18.86

(

`

in Crore)

28Slide29

Non Interest Income

Particulars

Quarter ended

Variation

Y-o-Y %

Nine Months endedVariationY-o-Y %Dec-12Dec-13Dec-12Dec-13 Commission, Exchange & Brokerage29335420.82883101915.40 Profit from Sale of Investments8612747.67290712145.52

Profit from Exchange Transactions181

207

14.36459

629

37.04

Recovery In W/o accounts

246226

-8.13

649

592

-8.78

Other Non Interest Income131

183

39.69

391

426

8.95

Total Non Interest Income

937

1097

17.08

2,672

3378

26.42

(`

in Crore)

29Slide30

Profitability

Income

Quarter ended

Variation

Y-o-Y %

Nine months endedVariationY-o-Y %Dec 12 Dec 13Dec 12Dec 131. Total Income8,9601086621.2726,4093092817.11 a. Interest Income8,023976921.7623,7372755016.06 b. Non Interest Income937109717.082,672337826.422. Total Expenditure

7,1048722

22.7821,026

2450116.53

a. Interest expended

5,7147050

23.38

17,18919767

15.00

b. Operating Expenses1,390

1672

20.29

3,8374735

23.40

3. Operating Profit1,856

2144

15.52

5,383

6427

19.39

4. Net Profit803

586

-27.02

1,993

2172

8.98

(`

in Crore)

30Slide31

Income

Quarter ended

Variation

Y-o-Y %

Nine months ended

VariationY-o-Y %Dec 12Dec 13Dec 12 Dec 13Operating Profit1,856214415.525,383642719.39Provisions


Provisions

for Taxation

137

154

12.41

451

925

105.10

Prov. For B&D

591

1173

98.48

2637

2836

7.55

Prov.

For Standard Assets

179

122

-31.84

209

360

72.25

Prov. For Depreciation on Investment

20

34

70.00

-182

-91

-50.00

NPV

Provisions/

Other Provisions

126

75

-40.48

275

225

-18.18

Total Provisions

1,052

1558

48.10

3,391

4255

25.48

Net Profit

803

586

-27.02

1,993

2172

8.98

(`

in Crore)

31

ProvisionsSlide32

32

(

`

in

Crore)Basel - II Dec-12March-13June-13Sep-13Dec-13TIER I CAPITAL20,24623,01823,03523,04024,045TIER II CAPITAL7,8307,9167,7489,5179,945

TOTAL CAPITAL28,076

30,93430,782

32,557

33,990

TOTAL ASSETS

415,966

452,602

485,825

513,042536,492

RISK WEIGHTED ASSETS

265,082

280,637

288,799

299,777

318,732

CRAR - TIER I (%)

7.64

8.20

7.98

7.69

8.10*

CRAR - TIER II (%)

2.95

2.82

2.68

3.17

3.12

CRAR (%)

10.59

11.02

10.66

10.86

11.22*

Capital Adequacy Basel-III

-

-

10.36

10.77

10.84

Capital Adequacy – Basel-II (Q-o-Q)

* Taking into consideration profit for 9 months after adjustment of dividendSlide33

33

Parameter

Domestic

Foreign

Dec-12

Dec-13Dec-12Dec-13Cost of Deposits7.297.161.320.99Cost of Funds6.896.702.181.73Yield on Advances11.5811.323.142.58Yield on Investments7.948.355.523.98Yield on Funds9.399.203.392.76Interest Spread2.50

2.501.22

1.03NIM

2.73

2.891.27

1.10Cost to

Income Ratio44.26

45.3223.32

21.64

Return on Assets (ROA)0.70

0.60

0.440.44

Cost & Yield

Ratios

Parameter

Dec-12

Dec-13

Return on Equity

13.45

12.60

Book value per Share (

Rs

.)

361.21

378.86

Earning per share (

Rs

.)

34.73

36.23Slide34

Investments (Domestic)

Dec- 12

Dec- 13

AFS

HTMHFTTOTALAFSHTMHFTTOTAL1. SLR INVESTMENTS13971576502571646128517463229087773OF WHICH:GOVERNMENT SECURITIES

139715748225

71478

12851

74476

290

87617

OTHER APPROVED SECURITIES-

168

-

168

-

156

-

156

M Duration

-

-

-

-


3.60

5.07


5.81


4.85

2. NON SLR INVESTMENTS

10140

1087

1.1

11228

14984

1146

-

16129

M Duration

-

-

-

-

2.35

0.49


-


2.31

TOTAL

24111

58737

26

82875

27834

75778

290

103902

(

`

in

Crore)

34Slide35

Awards & Accolades

Bank has been awarded the ‘Outlook Money Award 2012’ for “

Best Education

Loan provider

”.

Bank has been rated by Economic Times as the “Second Most Trusted Brand in India” among the PSU banks. Bank has been ranked Second by Ministry of MSME, New Delhi based on its performance in lending to Micro Enterprises.Bank has received “Best Banker” award at the India SME excellence Awards-2013, for exemplary contribution in Banking Sector.Bank received MSME Excellence Award 2013 at the hands of Deputy Chairman, Planning Commission, Govt. of India.Bank received IBA Instituted award at BANCON 2013 for Most Innovative Mass Retail Lender for underserved segments.35Slide36

Awards &

Accolades (cont’d)

Bank

received Certificate of Recognition of Unique Achievements in the area of Data Centre from

CIO Masters for the year 2013

..Bank received SKOCH Award for India’s Best Project on Innovation for 2013 for introducing Passbook printing Kiosk and Account Balance through a missed call to a dedicated phone number . Bank also received Certificate of appreciation, awarded by Computer Society of India for the Project – Financial Inclusion through Information Communication Technology (ICT) enabled solution.Bank received the Certificate of Excellence for IT Security implementation – STARTOKEN Next generation Two Factor Authentication, from eIndia.Bank’s In-house Journal ‘Taarangan’ has been conferred with award for Brand Excellence by Asian Confederation of Business during 3rd Asian Leadership Awards 2013 held at Dubai on 24th Sepember 2013. 36Slide37

37

Our Motto “PERFORM TO POTENTIAL”.

Emphasis on CASA growth.

Expansion of SME, Retail and Rural Business.

Focus on Credit Monitoring and Recovery in NPA.

Inclusive Growth through Financial Inclusion.Progress on Alternate Delivery Channels for better Customer Satisfaction.Focused attention on Human Resources.Way ForwardSlide38

38