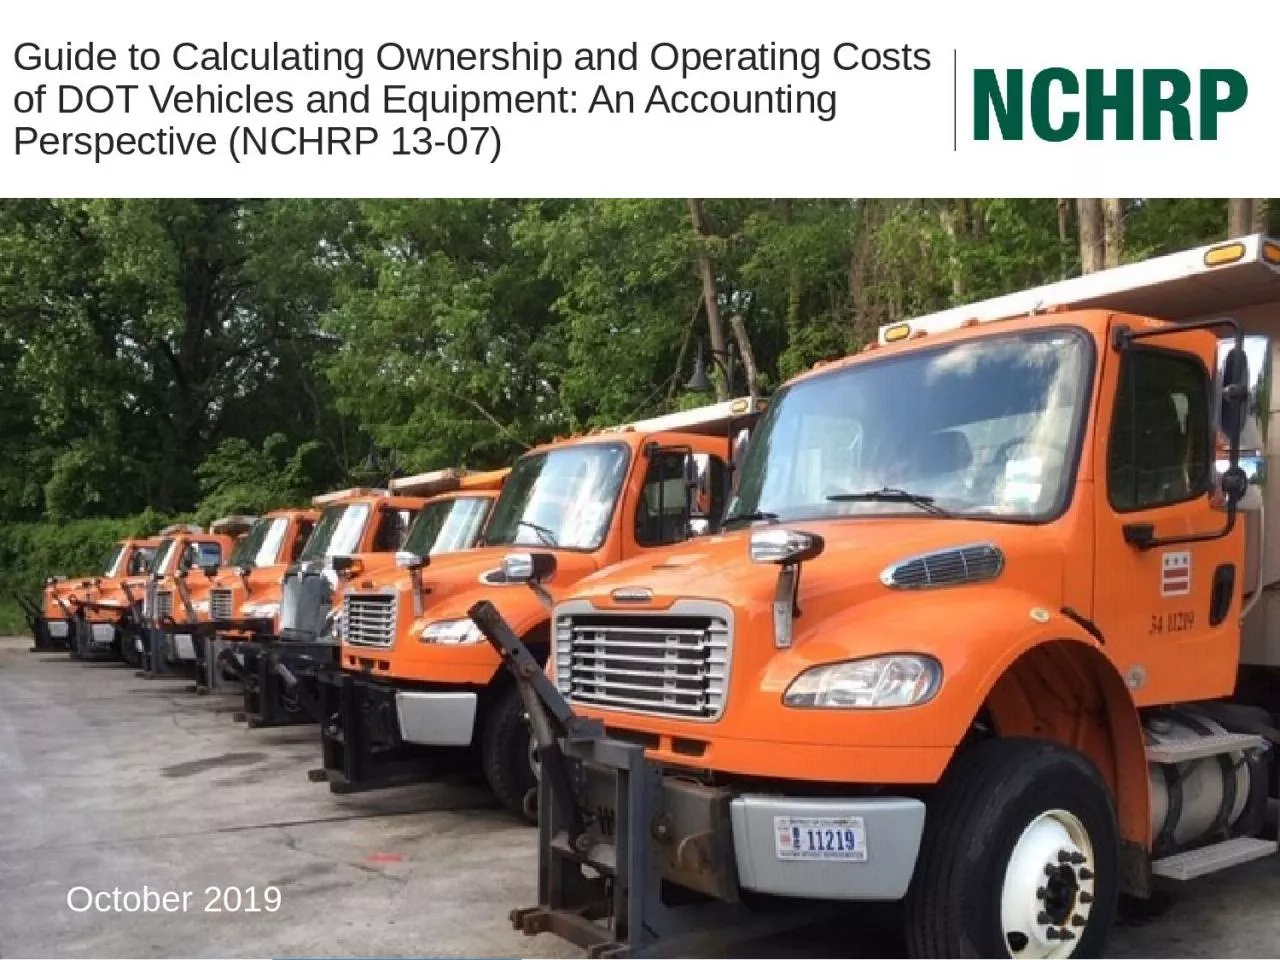
/
Guide to Calculating Ownership and Operating Costs of DOT Vehicles and Equipment: An Guide to Calculating Ownership and Operating Costs of DOT Vehicles and Equipment: An

Guide to Calculating Ownership and Operating Costs of DOT Vehicles and Equipment: An - PowerPoint Presentation

felicity
felicity . @felicity
Follow
69 views
Uploaded On 2023-11-05

Guide to Calculating Ownership and Operating Costs of DOT Vehicles and Equipment: An - PPT Presentation

Accounting Perspective NCHRP 1307 October 2019 Project Team 2 Authors Dr Geoff Morrison Cadmus Henry Canipe Kercher Group Andy Burnham Argonne National Lab NCHRP Project Panel Dr Andy Lemer NCHRP ID: 1028983

cost 000 costs fleet 000 cost fleet costs equipment hours provision accounting services support indirect repair 500 maintenance activity

Share:

Link:

Embed:

Download Presentation from below link

Download Presentation The PPT/PDF document "Guide to Calculating Ownership and Opera..." is the property of its rightful owner. Permission is granted to download and print the materials on this web site for personal, non-commercial use only, and to display it on your personal computer provided you do not modify the materials and that you retain all copyright notices contained in the materials. By downloading content from our website, you accept the terms of this agreement.


Presentation Transcript

1. Guide to Calculating Ownership and Operating Costs of DOT Vehicles and Equipment: An Accounting Perspective (NCHRP 13-07) October 2019

2. Project Team2AuthorsDr. Geoff Morrison, CadmusHenry Canipe, Kercher GroupAndy Burnham, Argonne National LabNCHRP Project PanelDr. Andy Lemer, NCHRP W. Daniel Keel, NCDOTJohn White, SCDOTChris Hebel, Texas DOTBruce Erikson, Oregon DOTDanny Keene, Arkansas DOTMelissa Boyer, New Jersey DOTMorgan Kessler, US DOTTim Cunningham Kansas DOTBob Ellingsworth, Minnesota DOTMichael Mayer, California DOT

3. 3AgendaIntroduction to GuideFundamentals of Fleet Cost AccountingEight-Step Cost Accounting ProcessHypothetical Fleet ExampleKey Considerations for Fleet Cost Accounting

4. Introduction to Guide

5. How Fleet Managers Use Cost Information5Equipment Replacement DecisionEquipment Retention or Removal DecisionOutsource Decision Justification of Costs to StakeholdersFleet Cost-Recovery Rates Identification of Program Strengths and WeaknessesSix key uses of cost information by fleet managers

6. Target Audience for Guide6Guide is useful for all levels of fleet stakeholdersShop staffFleet and equipment managersState maintenance engineersHigh-level DOT staff, politicians, and government decision makers

7. The Art of Fleet Cost Accounting7Art of Cost Accounting“The fact is, accounting and finance… really are as much art as they are science. We think that if a number shows up on the financial statements or the finance department reports to management, it must accurately represent reality… The art of accounting and finance is the art of using limited data to come as close as possible to an accurate description of how well a company is performing. Accounting and finance are not reality, they are a reflection of reality.” – Berman, Knight, and Case (2006)The Guide provides a step-by-step process but common sense and intuition are at least equally important factors when performing fleet cost accounting.

8. Fundamentals of Fleet Cost Accounting

9. Life Cycle Costing (LCC)9A key output in fleet cost accounting is equipment cost to perform LCC analysis

10. Six Uses of Fleet Cost Information10Equipment Replacement Decision. Identifying specific pieces of equipment within a class of equipment (e.g., snowplows) that are the worst performing from a cost perspective. Outsource Decision. Understanding if certain functions of the fleet are more cost-effective if contracted from a private firm, rather than performed by the fleet. Equipment Retention or Removal Decision. Identifying which assets should be removed from service entirely and retired. Justification of Costs to Stakeholders. Communicating cost information to both internal and external stakeholders, such as senior decision-makers, politicians, and internal staff. Fleet Cost-Recovery Rates. Calculating rates charged to users of fleet services. Identification of Program Strengths and Weaknesses. Identifying programs or elements of programs within a DOT that are most cost-effective or poorly performing.

11. How to Organize Costs to Address Uses11The Guide recommends using the Activity-Based Costing approach, which organizes fleet costs by activityMajor Fleet ActivitiesEquipment Provision: Providing vehicles to usersMaintenance and Repair Provision: Providing maintenance and repair services to equipmentParts Provision: Providing parts for equipmentFuel Provision: Providing fuel to equipment

12. Eight-Step Process for Fleet Cost Accounting

13. Eight-Step Process of Fleet Cost Accounting13Identify users of cost accounting informationReview Current Fleet Cost Accounting Practices Identify Direct and Indirect Costs of Fleet Services and Equipment Determine Equipment Groupings 5. Apply ABC Approach 6. Apply Markup for Contingencies 7. Determine a Method for Aggregating Costs to the Appropriate Level Within Organization (Equipment-Level, District, etc.) 8. Estimate Costs into Future to Understand Impacts from Use and Aging, Technology Change, and Deferral of Spending Eight Steps for Fleet Cost Accounting

14. Hypothetical Fleet Example

15. Hypothetical Fleet Description151,000 passenger sedans 4,000 half-ton pickup trucks10 shops spread out between five districts and One central fleet office at the state DOT building 40 mechanics5 parts and supplies personnel3 managersAdditionally, a team of 4 accountants provides partial support to fleet activities.

16. Summary of Direct and Indirect Costs16Direct or IndirectDetailed CostDivision that PaysCosts($ per year)DirectEquipment inspectionFleet Services$1,000,000 DirectFuelMaintenance Division$2,000,000 DirectParts acquisitionMaintenance Division$1,000,000 DirectMechanic laborFleet Services$5,000,000 DirectTiresFleet Services$500,000 DirectUpfitting accessoriesMaintenance Division$500,000 DirectRegistration and feesFleet Services$50,000DirectVehicle purchase costMaintenance Division$20,000,000 Total Direct Costs$30,050,000    IndirectAccounting supportAccounting Division$4,000,000* IndirectPension/401K contributions Maintenance Division$2,000,000* IndirectJanitorial servicesSupport Services$1,000,000* IndirectOffice suppliesHuman Resources$1,000,000* IndirectRefuse servicesSupport Services$500,000* IndirectSoftwareInformation Technology$400,000* IndirectTrainingSupport Services$500,000* IndirectUniformsSupport Services$600,000* IndirectUtilities (gas, water, electric, etc.)Support Services$7,000,000* IndirectVacation and sick timeHuman Resources$3,000,000* Total Indirect Costs (including non-fleet costs)$20,000,000

17. Classify Direct Costs by Activity17Direct CostActivityCosts* ($ per year)Subtotals by ActivityEquipment inspectionEquipment Provision $1,000,000  Upfitting accessoriesEquipment Provision $500,000  Vehicle purchase costEquipment Provision $20,000,000  Registration and feesEquipment Provision $50,000 Equipment Provision subtotal $21,550,000 FuelFuel Provision$2,000,000  Fuel Provision subtotal $2,000,000 Mechanic laborMaintenance & Repair$5,000,000  Maintenance & Repair subtotal $5,000,000 Parts acquisitionParts Provision$1,000,000  TiresParts Provision$500,000  Parts Provision subtotal $1,500,000 Grand Total $30,050,000

18. Identify Cost Drivers for Indirect Costs18Indirect CostCost DriverAccounting supportFraction of hours accounting staff support each activityPension/401K contributions Fraction of hours employees support each activityJanitorial servicesFraction of square feet of indoor space occupied by each activity Office suppliesFraction of total office supplies consumed to support each activityRefuse servicesFraction of square feet of indoor space occupied by each activity SoftwareFraction of hours software is used to support each activityTrainingFraction of hours employees involved in training support each activityUniformsFraction of hours employees who wear uniforms support each activityUtilities (gas, water, electric, etc.)Fraction of square feet of indoor space occupied by each activity Vacation and sick timeFraction of hours employees support each activity

19. Allocate Costs into Activities19

20. Calculate Detailed Costs by Activity20Each activity uses a different metric for benchmarkingEquipment$/mile or $/hourMaint. & Repair$/hourParts% MarkupFuel$/gallon cost adder

21. Equipment Provision21Three methods for doing the final allocation of indirect costs to the equipment provision1. Unit-based cost driverSpread indirect costs evenly to all equipment. Downside of approach is it over-burdens low cost equipment and under-burdens high cost equipment2. Percentage of direct costSpread indirect costs based on the relative fractions of the direct costs. Downside of approach is that true direct and indirect costs may not be correlated.3. Vehicle Equivalency Units (VEUs)Spread indirect costs using the relative VEUs of the equipment.

22. Maintenance & Repair Provision22The Maintenance & Repair Provision is also called the “shop rate”Available hours are number of hours an employee is paid Productive labor hours are the hours available to perform maintenance and repair. Billable hours are the hours spent performing the maintenance and repair.Non-billable hours are hours spent on training, breaks, and clean-up.Productivity ratio is the fraction of hours that are billable each day. Fleets interviewed for this guide have 75 to 80 percent productivity ratios, meaning they spend an average of 6.0 to 6.4 hours per day on billable activities. *Note the importance of removing vacation, holiday, and sick time before calculating productivity ratio.

23. Parts and Fuel Markups23Parts and fuel are typically benchmarked using their markupsPartsFuelAmountParts Cost Category$1,500,000 Actual parts cost$100,000 Indirect parts support costs6.67%Part mark-up requiredCostFuel Cost Category$200,000Fuel support costs to be covered by mark-up1,000,000Gallons of fuel$0.20Fuel mark-up per gallon

24. Key Considerations

25. Key Considerations in Fleet Cost Accounting25Cost accounting is an art, not a scienceAlways weigh precision versus effortIndirect costs should be included if they would be eliminated when the activity is outsourcesAmortize all equipment and make-ready costs. Segregate accident and operator-caused repair costsCreating Standard Operating Procedures (SOPs) for Collecting and Entering Fleet Data

26. Thank You / Q&A