/
TCS: A new multiple sequence alignment reliability measure to estimate alignment accuracy TCS: A new multiple sequence alignment reliability measure to estimate alignment accuracy

TCS: A new multiple sequence alignment reliability measure to estimate alignment accuracy - PowerPoint Presentation

felicity
felicity . @felicity
Follow
352 views
Uploaded On 2022-05-17

TCS: A new multiple sequence alignment reliability measure to estimate alignment accuracy - PPT Presentation

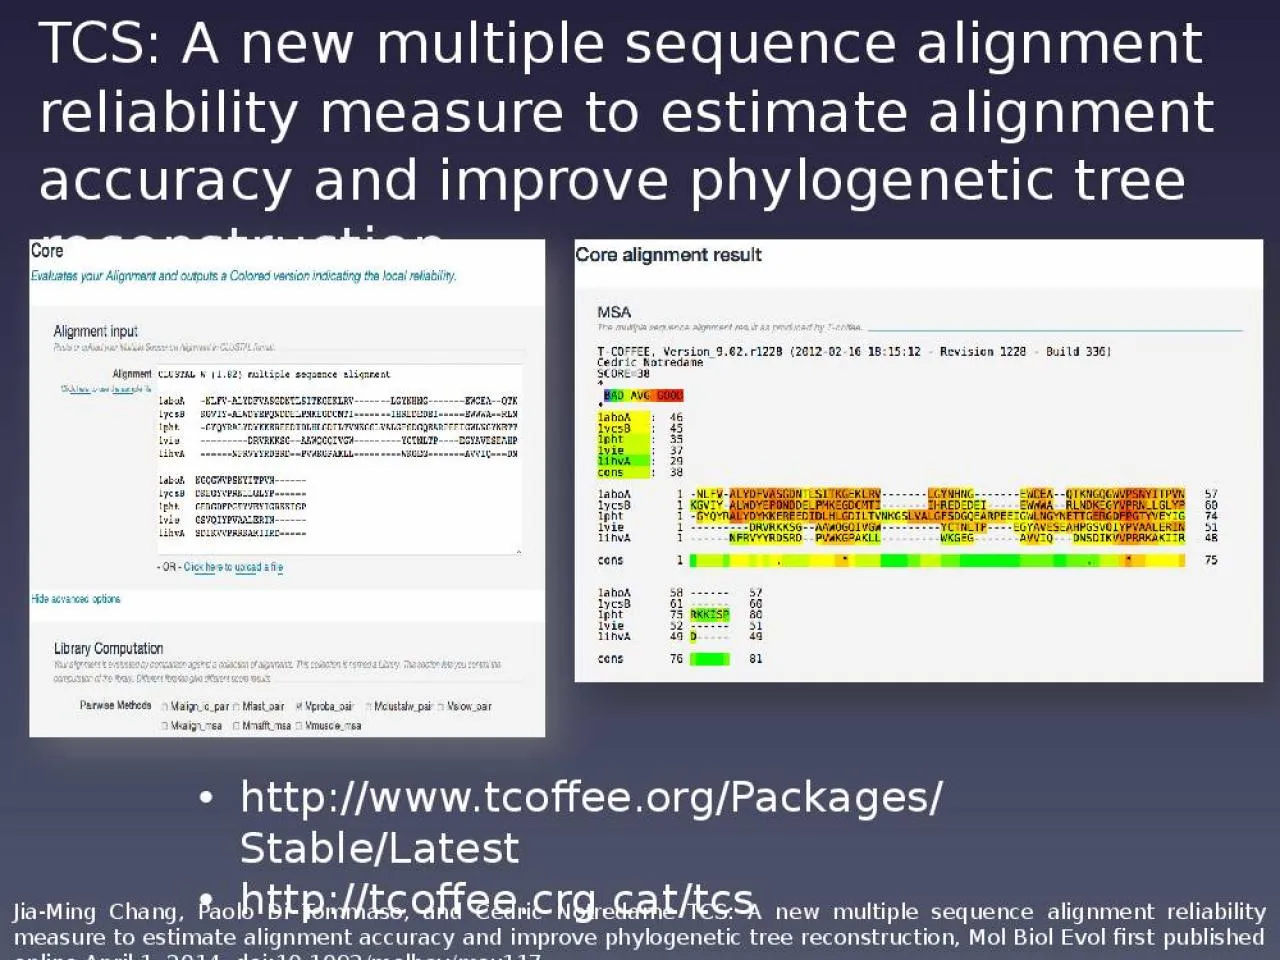
Jia Ming Chang Paolo Di Tommaso and Cedric Notredame TCS A new multiple sequence alignment reliability measure to estimate alignment accuracy and improve phylogenetic tree reconstruction ID: 911426

tcs alignment msa score alignment tcs score msa alignments sequence multiple seq level ssum guidance tree lib opo library

Share:

Link:

Embed:

Download Presentation from below link

Download Presentation The PPT/PDF document "TCS: A new multiple sequence alignment r..." is the property of its rightful owner. Permission is granted to download and print the materials on this web site for personal, non-commercial use only, and to display it on your personal computer provided you do not modify the materials and that you retain all copyright notices contained in the materials. By downloading content from our website, you accept the terms of this agreement.


Presentation Transcript

Slide1

TCS: A new multiple sequence alignment reliability measure to estimate alignment accuracy and improve phylogenetic tree reconstruction

Jia-Ming Chang, Paolo Di Tommaso, and Cedric Notredame TCS: A new multiple sequence alignment reliability measure to estimate alignment accuracy and improve phylogenetic tree reconstruction, Mol Biol Evol first published online April 1, 2014, doi:10.1093/molbev/msu117

http://www.tcoffee.org/Packages/Stable/Latest

http

://

tcoffee.crg.cat

/

tcs

Slide2

alignment uncertainty - data

Aln1

OPO

SSUM--

BLOS-UM62

Aln2

OPO

SSUM--

BLO-SUM62

OPO

SSUM

BLOSUM62

Landan

G,

Graur D (2007) Heads or Tails: A Simple Reliability Check for Multiple Sequence Alignments. Molecular Biology and Evolution 24: 1380 –1383.

MUSSOPO26MUSOLB

MSA

Slide3

alignment uncertainty - data

Aln1OPO

SSUM--

BLOS-UM62

Aln2

OPO

SSUM--

BLO-SUM62

O

P

O

SS

UM

B\BL\

L

O\OS

\

\

S

U

\

U

M

\

M

6

|

6

2

|2OPOSSUM

Landan

G,

Graur D (2007) Heads or Tails: A Simple Reliability Check for Multiple Sequence Alignments. Molecular Biology and Evolution 24: 1380 –1383.

If

there are

two

paths

{

chooses low-road;

}

Slide4

alignment uncertainty - data

It gets worse with a multiple sequence alignment.Aln1

BLOS-UM45

OPO

SSUM--

BLOS-UM62

Aln3

BLO-SUM45

OPO

SSUM--BLO-SUM62

Aln2

BLO-SUM45

OPO

SSUM--BLOS-UM62

Aln4

BLOS-UM45OPOSSUM--BLO-SUM62

Telling apart

Uncertainty

parts of the alignment is more important than the overall

accuracy.

Slide5

Guidance

Penn O, Privman E, Landan G, Graur D, Pupko T (2010) An alignment confidence score capturing robustness to guide tree uncertainty. Mol Biol Evol

27: 1759–1767.

Slide6

Which alignment task is difficult?

pairwise alignment

multiple sequence

alignment

3*

l

2

l

3

If

l

= 200, the second is 66 times slower than the first

l

Slide7

x

y

MSA

Pairwise alignments

x

y

consistency

Where are samples?

Consistency between

MSA &

pairwise

alignment :

0/1

How can we increase the resolution of confidence?

Slide8

Transitive relation

In mathematics, a binary relation R over a set X is transitive if whenever an element a is related to an element b, and b is in turn related to an element c, then a is also related to c. -WikiPedia

Slide9

Transitive relation in alignment scene

consistency

multiple sequence

alignment

x

y

pairwise alignment

x

a

a

y

Slide10

x

y

x

a

x

d

a

y

x

b

e

y

c

y

MSA

Pairwise alignments

c

onsistency

inconsistency

inconsistency

Slide11

x

y

x

a

x

d

a

y

x

b

e

y

c

y

MSA

c

onsistency

inconsistency

inconsistency

TCS

(

x,y

)=

76

93

78

71

80

81

76

71

80

76

76

+

71

+

80

Slide12

MAFFT

Kalign

MUSCLE

Probcons

: C. B. Do, M. S. P.

Mahabhashyam

, M.

Brudno

, S.

Batzoglou, Genome Res (2005). MAFFT: K. Katoh, K. Misawa, K. Kuma, T. Miyata, Nucleic Acids Res., (2002). MUSCLE: R. C. Edgar, Nucl. Acids Res. (2004). Kalign: T.

Lassmann

, E. L. L. Sonnhammer, BMC Bioinformatics (2005).

TCS_Original

Library

ProbCons

biphasic pair-HMMTCSTCS_FM

Slide13

T-COFFEE, Version_9.01 (2012-01-27 09:40:38)

Cedric Notredame CPU TIME:0 sec.SCORE=76* BAD AVG GOOD*1j46_A : 742lef_A : 751k99_A : 771aab_ : 72cons : 761j46_A 75------4566---677777777777777777776666--7789999

2lef_A 6--------566---677777777777777777777766--77899991k99_A 865454445667---777788887888888888877877--77899991aab_ 76------5665333566676666666666666666655336789999

cons 641111113455122566777666666777777666655215689999

CLUSTAL W (1.83) multiple sequence alignment

1j46_A MQ------DRVKRP---MNAFIVWSRDQRRKMALENPRMRN--SEISKQL

2lef_A MH--------IKKP---LNAFMLYMKEMRANVVAESTLKES--AAINQIL

1k99_A MKKLKKHPDFPKKP---LTPYFRFFMEKRAKYAKLHPEMSN--LDLTKIL

1aab_ GK------GDPKKPRGKMSSYAFFVQTSREEHKKKHPDASVNFSEFSKKC : *:* :..: : * : . :.:

Col row row TCS1 1 2 0.7621 1 3 0.7481 1 4 0.7411 2 3 0.6511 2 4 0.6771 3 4 0.6932

1 3 0.562

2 1 4 0.6322 3 4 0.526

TCSResidue level

Alignment level

Column level

Slide14

Structural modeling

Evolutionary modeling

T-COFFEE, Version_9.01 (2012-01-27 09:40:38)

Cedric Notredame CPU TIME:0 sec.

SCORE=76

*

BAD AVG GOOD

*

1j46_A : 742lef_A : 751k99_A : 771aab_ : 72cons : 761j46_A 75------4566---677777777777777777776666--7789999

2lef_A 6--------566---677777777777777777777766--77899991k99_A 865454445667---777788887888888888877877--77899991aab_ 76------5665333566676666666666666666655336789999cons 641111113455122566777666666777777666655215689999Col row row TCS1 1 2 0.7621 1 3 0.7481 1 4 0.741

1 2 3 0.651

1 2 4 0.6771 3 4 0.693

2 1 3 0.5622 1 4 0.632

2 3 4 0.526…Residue level

Alignment level

Column level

Slide15

Q1: Is Transitive Consistency Score an Indicator of Accuracy?

Slide16

Test1 - structural modeling @ residue level

Seq1 …SALMLWLSAR

ESIKREN…YPD…

Seq2 …SAY

NIYVSF

Q

---

-

RESA…KD……

SeqnLY

D

D

Score 2

L Y 100D D 90R Q 50Score 1L Y 100R Q 70D D

60

RR

BAliBASE 3, PREFAB 4

MAFFT, ClustalW, Muscle, PRANK, SATe

HoT, Guidance, TCS

Slide17

Score 2

L Y 100 TPD D 90 TPR Q 50 FPScore 1

L Y 100 TPR Q 70

FPD D 60 TP

AUC measurement

Penn O,

Privman

E, Ashkenazy H,

Landan

G, Graur D, Pupko T: GUIDANCE: a web server for assessing alignment confidence scores. Nucleic Acids Res 2010, 38(Web Server issue):W23-28.Penn O, Privman E, Landan G, Graur

D,

Pupko T: An alignment confidence score capturing robustness to guide tree uncertainty. Mol Biol

Evol 2010, 27(8):1759-1767.Landan G,

Graur D: Heads or tails: a simple reliability check for multiple sequence alignments. Mol Biol Evol 2007, 24(6):1380-1383. 57 citation by Google

75 citation by Google

Slide18

Evaluation

The Alignments are made by 3 methodsMAFFT 6.711MUSCLE 3.8.31ClustalW 2.1The Alignments are evaluated with 3 methodsT-Coffee CoreGuidance

HoT

Slide19

MAFFT

ClustalWMUSCLE

TCS

94.44

96.46

94.51

Guidance

90.28

87.69

94.51HoT

82.66

90.95

-

BAliBASE SP

0.807

0.7140.793

0.765

0.831

TCS is the most informative & the most stable measure across aligners.

PRANK

SATe

96.93

93.25

91.68

-

-

-

PREFAB SP

0.595

0.661

0.649

0.614

0.686

TCS

90.81

89.24

87.96

92.31

86.77

Guidance

85.74

80.64

85.60

87.34

-

HoT

80.30

83.94

-

-

-

AUC

Slide20

How about difficult alignment sets?

BAliBASE RV11PREFAB 0~20SP

0.536

0.465TCS

91.11

87.16

Guidance

83.51

86.03HoT

72.6381.35How about easy alignment sets? BAliBASE RV12PREFAB 70~100SP

0.888

0.942TCS

96.8378.98

Guidance92.6462.01HoT78.7957.96MAFFT

Slide21

How about different library protocols?

Time(s)*17,24466,368

3,09316,449

TCS

Guidance

TCS_FM

HoT

*measured in MAFFT

BAliBASE

PREFAB

94.44

89.24

90.28

85.7487.28

80.0382.66

80.30

Slide22

Fig. 1. Specificity and Sensitivity of the TCS indexes in structure correctness analysis for different alignments. All points correspond to

measurments done by removing all residues within the target MSA having a ResidueTCS score lower or equal than the considered threshold.

Slide23

Q2: Is Transitive Consistency Score an Indicator of good aligner?

Slide24

reference alignment

Seq1 …SALMLWLSARESIKREN…YPD…Seq2 …SAYNIYVSFQ----RESA…KD…

…Seq

n …SAYNIYVSAQ----RENA…KD…

Seq1 …SALMLWLSARESIKREN…YPD…

Seq2 …SAYNIYVSF--

-

-QRESA…KD…

…Seqn …SAYNIYVSA----QRENA…KD…SSP1

SP2

confidence1

confidence2

Guidence/TCSSP1 – SP2 ? confidence1 – confidence2

Test

2 - structural modeling @ alignment level

Slide25

The sate of art

Kemena C, Taly JF, Kleinjung J, Notredame C: STRIKE: evaluation of protein MSAs using a single 3D structure. BIOINFORMATICS 2011, 27(24):3385-3391.

Slide26

Guidance

TCS= 71.10% = 83.5%

Slide27

Table 4. 

The prediction power of overall alignment correctness by library protocols and GUDIANCE applied to BAliBASE and PREFAB. “# comp.” denotes the number of the pair alignment comparisons. The best performance is marked in bold.

Slide28

Q3:Does Transitive Consistency Score help phylogenetic reconstruction?

Slide29

Test3 - Evolutionary Benchmark

Seq

MSA

MSA

post process

Gblocks

t

rimAl

wrTCS

b

uild tree

maximum

likelihood

Neighboring Joiningmaximum parsimonySimulation16 tips32 tips

64 tipsYeasts : 853

alignerMAFFTClustalWProbConsPRANKSATe

Robinson-Foulds distance

Slide30

Talavera G,

Castresana J (2007) Improvement of Phylogenies after Removing Divergent and Ambiguously Aligned Blocks from Protein Sequence Alignments. Syst Biol 56: 564–577.Gblocks419 citation by Google

trimAl

Capella-Gutiérrez

S,

Silla-Martínez

JM,

Gabaldón

T (2009) trimAl: a tool for automated alignment trimming in large-scale phylogenetic analyses. Bioinformatics 25: 1972–1973.

104 citation by Google

Slide31

Replication instead of filtering

gaps carry substantial phylogenetic signal, but are poorly exploited by most alignment and tree building programs;Dessimoz C, Gil M: Phylogenetic assessment of alignments reveals neglected tree signal in gaps. Genome Biol 2010, 11(4):R37.

1aboA -N

LFV-ALYDFVASGDNTLSITKGEKLRV-------LGYNHNG-----1ycsB K

G

V

IY-ALWDYEPQNDDELPMKEGDCMTI-------IHREDEDEI---

1pht

-GYQYRALYDYKKEREEDIDLHLGDILTVNKGSLVALGFSDGQEARPE1vie

---------DRVRKKSG--AAWQGQIVGW---------YCTNLTP---1ihvA ------NFRVYYRDSRD--PVWKGPAKLL---------WKGEG-----Original align.1aboA -4

4

45-66666676665455566655666-------6565544-----1ycsB 33

444-66666677775556666666666-------655554434---1pht -

544447766656566556666665555434446666666554455551vie ---------33344444--5555555555---------5555555---1ihvA ---

---33344444444--4555554433---------33344-----cons 133

332444343443333444455433331111223332221111111TCS scores1aboA -NNNLLL

... -1ycsB

KGGG

VVV ... -1pht

-GGGYYY ... E

1vie -

------ ... -

1ihvA ------- ... -

TCS enrich align

Slide32

Simulation: asymmetric = 2.0, ML

Slide33

853 Yeast ToL

RF: average Robinson-Foulds distance respect to Yeast ToL.TPs: the number of genes whose tree topology is identical with yeast ToL.

Slide34

TCS Evaluation Libraries

TCSt_coffee –seq <seq_file> -method proba_pair –out_lib <library> -lib_onlyTCS_originalt_coffee –seq <seq_file> -method clustalw_pair, lalign_id_pair –

out_lib <library> -lib_onlyTCS_FMt_coffee –

seq <seq_file> -method kafft_msa,kalign_msa,muscle_msa –out_lib <library> -

lib_only

Slide35

TCS output

t_coffee –infile=<target_MSA> –evaluate –lib <library> -output \ sp_ascii,score_ascii,score_html,score_pdf,tcs_column_filter2,tcs_weighted,tcs_replicate100sp_ascii is a format reporting the TCS score of every aligned pair (PairTCS) in the target MSA.score_ascii reports the average score of every individual residue (ResidueTCS

) along with the average score of every column (ColumnTCS) and the global MSA score (AlignmentTCS).

score_html score_ascii in html format with color code (Figure 4).score_pdf will transfer

score_html

into

pdf

format.

tcs_column_filter2 outputs an MSA in which columns having ColumnTCS lower than 2 are removed.tcs_weighted outputs an MSA in which columns are duplicated according to their ColumnTCS weight.tcs_replicate100 outputs 100 replicate MSAs in which columns are randomly drawn according to their weights (

ColumnTCS).

Slide36

Acknowledgments

Paolo Di

Tommaso

CRG

Cedric

Notredame

CRG

CB LAB

CRG

Slide37

Acknowledgments

Toni

Gabaldon,Mar

Alba,Matthieu

Louis,Romina

Grarrido

Ana Maria Rojas Mendoza,Arcadi Navarro,Fernando

Cores Prado

Slide38

tcoffee.crg.cat

/tcs

sites.google.com/site/changjiaming

chang.jiaming@gmail.com

Thank You