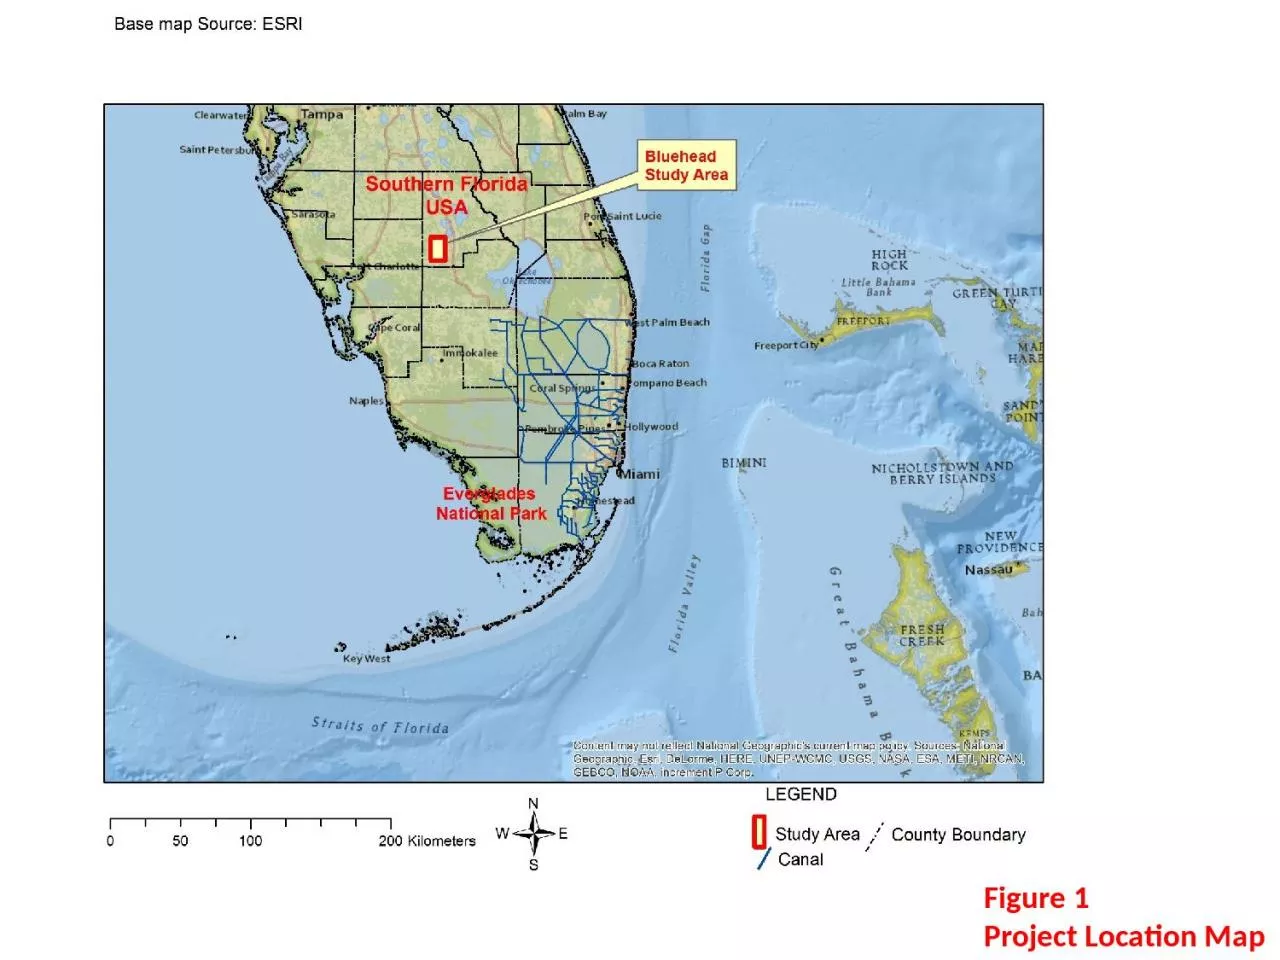
Figure 2 Watershed Location Map Figure 3 Topographic Map Map Source Loinaz 2005 Approximate Blue Head Ranch Property Line Elevations Ft above NAVD 1988 Figure 4 Property Location Map ID: 915758
Download Presentation The PPT/PDF document "Figure 1 Project Location Map" is the property of its rightful owner. Permission is granted to download and print the materials on this web site for personal, non-commercial use only, and to display it on your personal computer provided you do not modify the materials and that you retain all copyright notices contained in the materials. By downloading content from our website, you accept the terms of this agreement.
Slide1
Figure 1Project Location Map
Slide2Figure 2Watershed Location Map
Slide3Figure 3Topographic Map
Map Source:
Loinaz
(2005)
Approximate Blue Head
Ranch Property Line
Elevations (Ft above NAVD 1988
)
Slide4Figure 4
Property Location Map
Slide5Figure 5
Subbasins
in
Fisheating
Creek Watershed
Source:
Loinaz
(2005)
167.34 mi
246.35 mi220.45 mi27.64 mi2
4.73 mi2
42.24 mi24.35 mi2
6.44 mi
2
30.45 mi
2
50.52 mi
2
14.37 mi
2
19.31 mi
2
30.81 mi
2
Slide6Figure 6Key Subbasins
& Property
Upper
Fisheating
Creek
Fence Line
Drain
Joe Slough
Unnamed Drain
Carlton Ranch Run
Boothill
Creek
Central
Fisheating
Creek
Slide7Figure 7Subbasins contributing flow to Stream Gauges
Map Source:
Loinaz
(2005)
50.52 mi
2
30.81 mi
2
Contributing to
USGS 002255600
Upper
Fisheating
= 56 mi
2
Unnamed Drain = 4.35 mi
2
Sub-Total = 60.35 mi
2
Contributing to
FishV_O
Central
Fisheating
= 25 mi
2
Carlton Ranch Run = 6.44 mi
2
Sub-Total = 128.69 mi
2
Plus pass through = 189.04 mi
2
Fence Line Drain = 46.35 mi
2
Bootheel
Creek = 30.45 mi
2
Joe Slough = 20.45 mi
2
Contributing to
FishP
Lower
Fisheating
= 34 mi
2
Platt Branch = 14.37 mi
2
Sub-Total = 122.29 mi
2
Plus pass
through = 311.33 mi
2
Halpen
Marsh = 19.31 mi
2
Rainey Slough = 42.24 mi
2
Clay Slough = 4.73 mi
2
John Henry Slough = 7.64 mi
2
Contributing to
FishCR
Fisheating
Marsh = 51 mi
2
Gopher Gully= 30.81 mi
2
Sub-Total = 132.33 mi
2
Plus pass through = 433.66 mi
2
Gator Slough = 50.52 mi
2
13.92 %
43.59 %
71.79 %
100 %
Slide8Figure 8
Median and Mean Daily Flow per Area Values
Map Source:
Loinaz
(2005)
Contributing to
USGS 002255600
Sub-Total = 60.35 mi
2
Contributing to
FishV_O
Contributing to
FishP
Contributing to
FishCR
Med Q/Area = 0.0729
cfs
/mi
2
Median Q = 4.40
cfs
Mean Q = 53.07
cfs
Mean Q/Area = 0.8794
cfs
/mi
2
Sub-Total = 128.69 mi
2
Med Q/Area = 0.0979
cfs
/mi
2
Median Q = 12.60
cfs
Mean Q = 79.50
cfs
Mean Q/Area = 0.6178
cfs
/mi
2
Sub-Total = 122.29 mi
2
Med Q/Area = 0.1799
cfs
/mi
2
Median Q = 22.00
cfs
Mean Q = 121.99
cfs
Mean Q/Area = 0.9975
cfs
/mi
2
Sub-Total = 132.33 mi
2
Med Q/Area = 0.4232
cfs
/mi
2
Median Q = 56.00
cfs
Mean Q = 116.50
cfs
Mean Q/Area = 0.8804
cfs
/mi
2
Slide9Figure 9Key TP Water Quality Data
** TP annual loads represent likely maximum values for the watershed
Slide10Figure 10Key Model Hydrographs
Calibration Results at
FishV_O
, Simulated Flow
Calibration Results at
FishV_O
, Observed Flow
Slide11Figure 11Key Model Hydrographs
Calibration Results at
FishP
Calibration Results at
FishP
, Simulated Flow
Calibration Results at
FishP
, Observed Flow
Slide12Figure 12Key Model Hydrographs
Validation Results at
FishP
Validation Results at
FishP
, Simulated Flow
Validation Results at
FishP
, Observed Flow
Slide13Figure 13MODFLOW Model Domain
Not to Scale
Model Cells
Fisheating
Creek
Drain Cells
Constant Head
Boundary
Simulated
Recharge Basin
Slide14Figure 14
Alternative # 1
Alternative # 1
Fisheating
Creek
Map Sources: Blue Head Ranch & Cattle Company LLC and
Saunders Real Estate
Slide15Figure 15
Alternative # 1
Map Source: ESRI
Proposed 255 Acre footprint
With 225 Acres of treatment
Area using conventional STA
technology
Intake Pipe
Or Canal
Cell 2SAV
Cell 1
SAVOutletStructure andCanal
Not to Scale
Intake Pump
Station
Equalization Pool
Isolated Wetlands
Slide16Figure 16
Alternative # 2
Alternative # 2
Fisheating
Creek
Map Sources: Blue Head Ranch & Cattle Company LLC
Slide17Figure 17
Alternative # 2
Proposed 125 Acre
Footprint with ~ 100
Acre Treatment Area
Intake Pump
Station
Inlet Canal or
Pipeline
Not to Scale
Outlet Works
Equalization Pool
Map Sources: Blue Head Ranch & Cattle Company LLC
Slide18Figure 18
Alternative # 3
Alternative # 3
Fisheating
Creek
Map Sources: Blue Head Ranch & Cattle Company LLC and
Saunders Real Estate
Slide19Figure 19
Alternative # 3
Map Source: ESRI
Proposed 725 Acre footprint
With 500 Acres of treatment
Area using conventional STA
Technology and 200 Acres
Of Equalization Ponds for
Extended storage
Intake PipeOr Canal
Cell 2SAV
Cell 1SAVOutlet
Structure and
Canal
Not to Scale
Intake Pump
Station
Equalization Pool 1
Cell 3
SAV
Equalization Pool 2
Isolated Wetlands