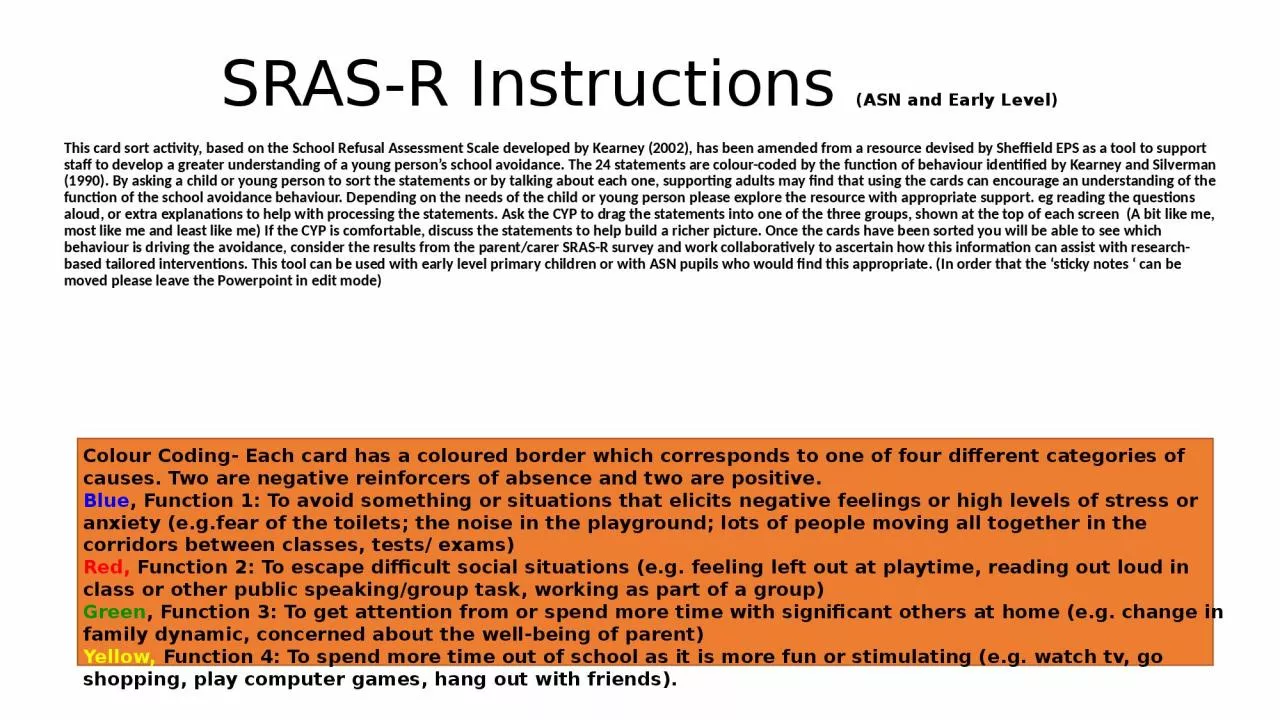
PPT-SRAS-R Instructions (ASN and Early Level)
Author : finley | Published Date : 2024-01-03
This card sort activity based on the School Refusal Assessment Scale developed by Kearney 2002 has been amended from a resource devised by Sheffield EPS as a tool
Presentation Embed Code
Download Presentation
Download Presentation The PPT/PDF document "SRAS-R Instructions (ASN and Early Leve..." is the property of its rightful owner. Permission is granted to download and print the materials on this website for personal, non-commercial use only, and to display it on your personal computer provided you do not modify the materials and that you retain all copyright notices contained in the materials. By downloading content from our website, you accept the terms of this agreement.
SRAS-R Instructions (ASN and Early Level): Transcript
This card sort activity based on the School Refusal Assessment Scale developed by Kearney 2002 has been amended from a resource devised by Sheffield EPS as a tool to support staff to develop a greater understanding of a young persons school avoidance The 24 statements are colourcoded by the function of behaviour identified by Kearney and Silverman 1990 By asking a child or young person to sort the statements or by talking about each one supporting adults may find that using the cards can encourage an understanding of the function of the school avoidance behaviour Depending on the needs of the child or young person please explore the resource with appropriate support . Last lesson we learnt about how sound is represented in a computer.. How does sampling work?. What does each sample get converted to?. Identify . how . instructions are represented . in a computer . system. Module 19. Learning Objectives. The difference between short-run and long-run macroeconomic equilibrium.. The causes and effects of . demand shocks. and . supply shocks. How to determine if an economy is experiencing a . Mankiw. M. acroeconomics. Principles . of. Sixth Edition. 20. In this chapter, . look for the answers to these questions:. What are economic fluctuations? What are their characteristics?. How does the model of aggregate demand and aggregate supply explain economic fluctuations?. Early Finisher Organization. Change it out weekly or monthly….. It allows students to have an extension . of previous learning. Keeps everyone busy and engaged . until others finish their task. Fiscal policy versus monetary policy. 1. Example 1. Suppose the government raises income taxes and issues bonds at the same time. Which of the following can best illustrate the overall effects of the above changes on price and output levels?. Anticipated and. Unanticipated Changes. Understanding Macroeconomics. —. Our Game Plan. Anticipated changes . are fully expected . by . economic participants. . Decision makers have time to adjust to . Anticipated and. Unanticipated Changes. Understanding Macroeconomics. -- Our Game Plan. Anticipated changes . are fully expected . by . economic participants. . Decision makers have time to adjust to . Day 1. Q1: During the Great Depression we saw a rise in unemployment and deflation. In the recession of 1979-1982 a rise in unemployment but inflation. Why?. Q2: What is stagflation?. Aggregate Supply and Aggregate Demand. Physical Therapy for ICU patients within 48 hours of ICU admission. Presented by Heidi Engel, PT, DPT. Heidi.Engel@ucsfmedctr.org. Steps Taken at UCSF- 9 ICU. Research. Promotion. Role models. UCSF 10 ICU/ICC. Tracing High-Level Disinfection April 26, 2019 Mary Cole, MSN, CJCP, CIC Consultant Joint Commission Resources , Inc. Publications and Record Restrictions Copyright © 2019 by Joint Commission Resources, Inc. All rights reserved. No part of this publication may be reproduced in any form or by any means without written permission from the publisher. Request for permission to make copies of any part of this work should be addressed to AD & AS Barnett UHS AP ECON Introduction Over the long run, real GDP grows about 3% per year on average. In the short run, GDP fluctuates around its trend. Recessions : periods of falling real incomes Roula Choueiri, MD . Chief, Division of Developmental & Behavioral Pediatrics. Neurodevelopmental Disabilities pediatrician. CDC Act Early Ambassador to MA. MA Act Early Interim State Team Leader. Hydrophobia Whathappensifyouplaceplasticsinwater? Resourcesneeded lastics packingpeanuts) Water Scrap aper othermaterialseg fewteaspoonfulsofsalt/sand/oil Crayonor crayons Wat Introduction & Determinants. Aggregate Demand Curve . (Inverse) Relationship between price level & quantity of aggregate output demanded for the economy as a whole. Aggregate Price Level (measured with GDP deflator).
Download Document
Here is the link to download the presentation.
"SRAS-R Instructions (ASN and Early Level)"The content belongs to its owner. You may download and print it for personal use, without modification, and keep all copyright notices. By downloading, you agree to these terms.
Related Documents