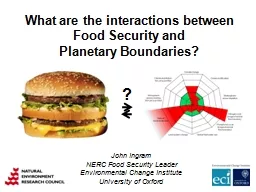
Food Security and Planetary Boundaries John Ingram NERC Food Security Leader Environmental Change Institute University of Oxford Food security exists when all people at all times have ID: 792400
Download The PPT/PDF document "What are the interactions between" is the property of its rightful owner. Permission is granted to download and print the materials on this web site for personal, non-commercial use only, and to display it on your personal computer provided you do not modify the materials and that you retain all copyright notices contained in the materials. By downloading content from our website, you accept the terms of this agreement.
Slide1
What are the interactions betweenFood Security andPlanetary Boundaries?
John IngramNERC Food Security LeaderEnvironmental Change InstituteUniversity of Oxford
?
Slide2Food security…
... exists when all people, at all times, have
physical and economic access to sufficient, safe, and nutritious food to meet their dietary needs and food preferences for an active and healthy life.
(UN-FAO World Food Summit 1996)… is more than food production… is underpinned by food systems
Slide3Slide4Food Security, i.e.
stability over time for:
FOOD UTILISATION
FOOD
ACCESS
Affordability
Allocation
Preference
Nutritional Value
Social Value
Food Safety
FOOD
AVAILABILITY
Production
Distribution
Exchange
Environmental
Welfare
Ecosystem stocks & flows
Ecosystem services
Planetary Boundaries
Social Welfare
Income
Employment
Wealth
Social capital
Political capital
Human capital
Food System OUTCOMES Contributing to:
Food System ACTIVITIES
Producing food
:
natural resources, inputs, markets, …
Processing & packaging
food: raw materials, standards, storage requirement, …Distributing & retailing food: transport, marketing, advertising, …Consuming food: acquisition, preparation, customs, …
GECAFS Food System Concept
... exists when all people, at all times, have
physical and economic access to sufficient, safe, and nutritious food to meet their dietary needs and food preferences for an active and healthy life.(World Food Summit 1996)
Slide5Food System ACTIVITIESProducing foodProcessing & Packaging food
Distributing & Retailing foodConsuming food
?
So what are the contributions of Food Systems to crossingPlanetary Boundaries?
Slide61: Agriculture as a driver of Land-cover Change
ExtensificationPressure on many (?all) Planetary BoundariesMillennium Ecosystem Assessment
Slide7Agriculture
13%
70% of arable GHG emissions connected with N fertilizer (manufacture, use):
CO2 & N2O
2: Agriculture as a driver of GHG emissions
EarthTrends
,
2008
Campbell 2011, based on Bennett
et al.
(in prep.)
Contribution of agriculture to
crossing planetary boundaries
Slide9Contribution of capture fisheries to
crossing planetary boundaries
Slide10Food System ACTIVITIES
Producing food: natural resources, inputs, markets, …Processing & packaging food:
raw materials, standards, storage requirement, …Distributing & retailing
food: transport, marketing, advertising, …Consuming food:
acquisition, preparation, customs, …
But ‘Food Systems’ involve more than producing food …
Slide11… and a major proportion of GHG emissions from food systems are not from agriculture
Edwards et al., Institute for Agriculture and Trade Policy,
2009
Slide12Food Processing
Common characteristics of wastes from the industryLarge amounts of organic materials such as proteins, carbohydrates, and lipidsLarge amounts of suspended solids depending on the source
High biochemical oxygen demand (BOD) and/or chemical oxygen demand (COD)
High N concentrationHigh suspended oil or grease contentsHigh variations in pHMost have higher levels than municipal sewageKroyer, 1995
Slide13Dupont & Renzetti, Can J Ag Econ
, 1998Food processing plants are responsible for 4.7% of total manufacturing intake but account for 5.2% of total consumption
Water use in Canadian food processing
Water use
Mm
3
/yr
% of all
industrial use
Intake
347.2
4.7
Discharge
320.1
Consumption
27.1
5.2
Processing Food
Slide14Packaging Food
Packaging:
some environmental issues
LitterUse of raw materials for packagingEase and convenience of packaging disposalAdverse consequences of careless disposal of packagingFeasibility of recycling or reuse
Real and virtual energy content
Slide15Guardian
1 February 2009Refrigerant leakage accounts for 30% of super-markets’ direct GHG emissions(Environment Investigation Agency, 2010)
Retailing food
Slide16The Co-operative Group Sustainability Report 2008/09
But the retail industry is “tidying up”Net GHG emissions connected with premises, transport and refrigerants
Slide17Consuming Food
Breakdown (%) of energy use in commercial kitchens in the US (broadly similar in the UK)
19
2319
Chartered Institution of Building Services Engineers, 2009
Slide18Consuming Food
Environmental and operational CO2 usage (kgCO2) per meal served
Facility
Environment
Operational
Combined
Primary School
0.07
0.11
0.18
Fast food outlet
0.19
0.29
0.48
Ministry of Defence:
junior ranks’ mess
officers’ mess
0.43
0.76
0.64
1.13
1.07
1.89
Chartered Institution of Building Services Engineers, 2009
Slide19Example contributions of
FSAs to PBsProducing foodProcessing & Packaging food
Distributing & Retailing food
Consuming foodClimate change
N cycle
P cycle
Fresh water use
Land use change
Biodiversity loss
Atmos.
aerosols
Chemical pollution
Slide20Example contributions of
FSAs to PBsProducing food
Processing & Packaging food
Distributing & Retailing foodConsuming foodClimate change
GHGs, albedo
EnergyEmissions from transport and
cold chainGHGs from cooking
N cycleEutrophicn
, GHGsEffluentNOx
from
transport
Waste
P cycle
P reserves
Detergents
Waste
Fresh water use
Irrigation
Washing, heating,
cooling
Cleaning food
Cooking,
cleaning
Land use change
Intensific
n
,
s
oil
degdn
Paper/card
Transport & retail infrastructureForest to edible oils plantationBiodiversity lossDeforestation, soils, fishing[Aluminium]Invasive spp
Consumer choicesAtmos.
aerosolsDustShipping
Smoke from cookingChemical pollutionPesticidesEffluentTransport emissionsCooking, cleaning
Slide21‘Food Security’ is now the BIG ISSUE
Independent
; 16 October 2011: World Food Day
Slide22LAC
53m
Asia & Pac
642m
SSA
265m
NENA 42m
Developed
15m
Food systems are already failing many:
1.02 billion people hungry in 2009
“In New York City the number of people having trouble paying for food has increased 60%, to 3.3m, since 2003 and ... a staggering one in five of the city's children rely on soup kitchens - up by 48% since
2004”
Economist
,
Jan 14th 2010
“One new food bank opens every week in UK as more people find they cannot afford to feed themselves and their families”
London Times,
April 17th 2012
Slide23Food systems are failinga further 2 billion!
1 billion with too
much food and/or “poor” diet
1 billion with insufficient nutrition
Slide24?
Food Security, i.e.
stability
over time for:
FOOD UTILISATION
FOOD
ACCESS
Affordability
Allocation
Preference
Nutritional Value
Social Value
Food Safety
FOOD
AVAILABILITY
Production
Distribution
Exchange
How do changes in Climate and other Planetary Boundaries affect Food Security?
Food security exists
when all people, at all times, have
physical and
economic access
to sufficient, safe, and nutritious food to meet their dietary needs and food preferences for an active and healthy life.
(World Food Summit, 1996)
Slide25Concern that climate change will undermine food production in many parts of the world…
Reduction in wheat yields 0 - 5%
5 -10% 10 -15%
15 - 20%
> 20%
Anticipated wheat yield
decline by 2030
Australia exports 15 Mt/
yr
(~19% of world exports)
Kokic
, et al.
Australian Commodities,
2005
Slide26… further compromised by O3 pollution.The accumulated hourly mean ozone concentration above 40 ppb, during daylight hours
Significant
yield losses for important food
crops
Adaptation
strategies were modelled,
e,g
. change of timing of crop growth period to avoid peak ozone, but no marked improvement was found
Slide27E
xtreme weather events also disrupt food distribution systems …
Slide28… and food storage …
Slide29Mycotoxins formed on plant products in the field or during storage
Residues of pesticides in plant products affected by changes in pest pressureTrace elements and/or heavy metals in plant products depending on changes in their abundance and availability in soils
Polycyclic aromatic hydrocarbons
in foods following changes in long-range atmospheric transport and deposition into the environmentMarine biotoxins in seafood following production of phycotoxins by harmful algal blooms
Pathogenic bacteria in foods following more frequent extreme weather conditions, such as flooding and heat waves.
… and food safety.
Miraglia
et al., Food and Chemical Toxicology, 2009
Slide30Weather-induced price spikes affect affordability
Slide31Consequences of the2008 Food Price Crisis
Slide32DRIVER
Interactions
Socioeconomic
DRIVERS
Changes in:
Demographics, Economics,
Socio-political context, Cultural contextScience & Technology
GEC DRIVERS
Changes in:
Land cover & soils, Atmospheric
Comp., Climate variability & means,
Water availability & quality,
Nutrient availability & cycling,
Biodiversity,
Sea currents
& salinity, Sea level
‘Natural’
DRIVERS
e.g. Volcanoes
Solar cycles
Environmental feedbacks
e.g. water quality, GHGs
Socioeconomic feedbacks
e.g. livelihoods, social cohesion
Food System ACTIVITIES
Producing food
Processing & Packaging food
Distributing & Retailing food
Consuming food
Food System OUTCOMES
Contributing to:
Social
Welfare
EnvironWelfare
Food
Utilisation
Food AccessFood Availability
Food Security
Bringing it all together
Need to consider FS:PB interactions
in context
of
drivers
and
feedbacks
Slide33So what do we do about it?Adapt to inevitable change
Mitigate further change
Slide34Adaptation
“doing things differently”Producing foodProcessing & packaging food
Distributing & retailing foodConsuming food
=> adapt our Food System “Activities”
Slide35Adaptation: Improved agriculture, livestock, horticulture, aquaculture, fisheries, …
More varied cropsStress-tolerant varieties
Wider range of food stuffs
Novel food producing systemsImprove water mgmtInsurance for producers…
Slide36Adaptation: Preserving crop varieties for the future
Opened 2008
> 4,000,000 samples
-18 oC “Climate-change proof”
Slide37Adaptation: Improving
food storage~ 15-25% losses to pests and damp in store
Slide38Adaptation: Considering novel foods?
Slide39Tuomisto & Teixeira
de Mattos. Env Sci & Tech, 2011
Slide40Mitigation: improving N-use efficiency?
China
grain production and fertilizer consumption (1980 = 100)
GrainFertilizer
Considerable food production achievement
BUT inefficient use (quantity, timing)
Slide41Still a need to improve N-use efficiency
N inputs – N output in cropkg N/ha/yrWestern Kenya (maize-based system)
-52
North China(maize-wheat)+227USA(maize-soybean)+10
Vitousek
et al
,
Science,
2009
Slide42Mitigation: reduced tillage?
Reduce SOC oxidation
Reduce input energy
Slide43At a C/N ratio of 12 in soil organic matter (SOM), 1 tonne of stored C requires 83 kg N/ha
At approximately $0.85/kg N applied, N cost of 1 tonne SOM is $71/haCurrent price of C on European market is <$25…Mitigation: Sequestering more carbon in soil?
Ken
Cassman, pers comm
N Cost of Carbon Sequestration
Slide44Mitigation: Reducing food miles?
The Well Travelled Yogurt Pot: Stefanie
Böge
Slide45Adaptation/Mitigation: Accepting
less choice?Tesco Oxford has 25,000 different food lines…
What about us as individuals?
Slide46Adaptation & Mitigation: Modifying
our diets?
=> One of the biggest, most immediate impacts!
Slide47Consume less red
meat and diary: Eat poultry in place of red meat and consume plant-based food rather than dairy two days per week
105
Waste less food:
Reduce consumer food wast
e by
25%
65
Behavioural Change and Personal Action
CO
2
emissions
Emissions
reductions (MtCO
2
e) achievable if adopted by 100% of the US population
Slide48Reducing food wasteMay occur anywhere along the supply chain, from farm to final consumerDifficult to measureGlobally, 15-50% of food is lost post-harvest
Often unnoticed until too late
Farmers
Processors
Final
Consumers
Transporters
Retailers
Input
Suppliers
Waste
Slide49Reducing
food waste
Derived from
Lundqvist, 2009 & Godfray et al, 2010
Slide50Every household in the UK wastes between £250 and £400 of food per year
Avoidable waste of cereal-based food in the UK and USA could lift 224 million people out of hungerProducing and distributing edible food that goes to waste accounts for around 5% of all UK GHG emissionsFood Ethics Council, 2009
Reducing food waste
Alleviating food insecurity by reducing food waste is as important as by increasing food production …… environmentally, economically and ethically!
Slide51Thank you!
?