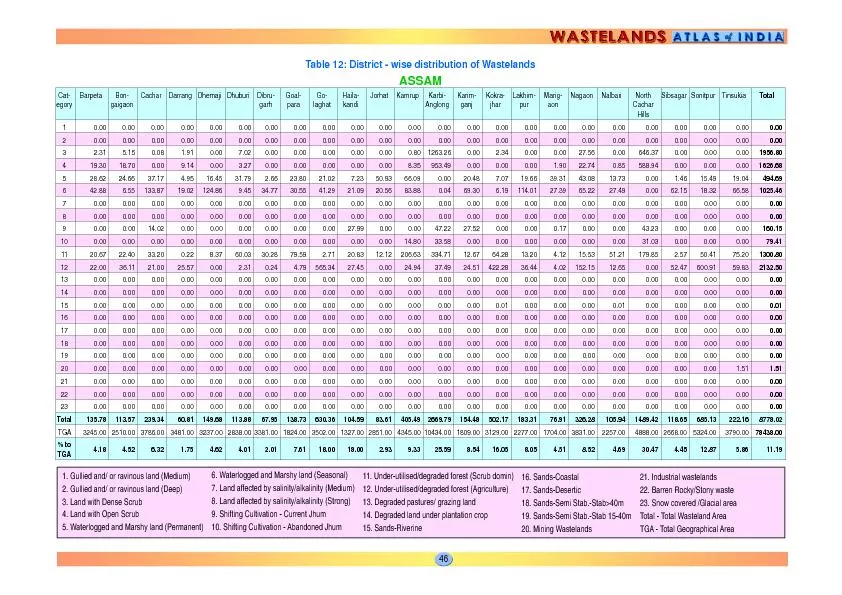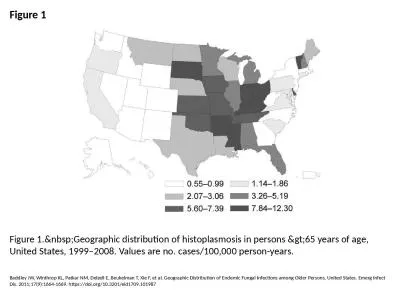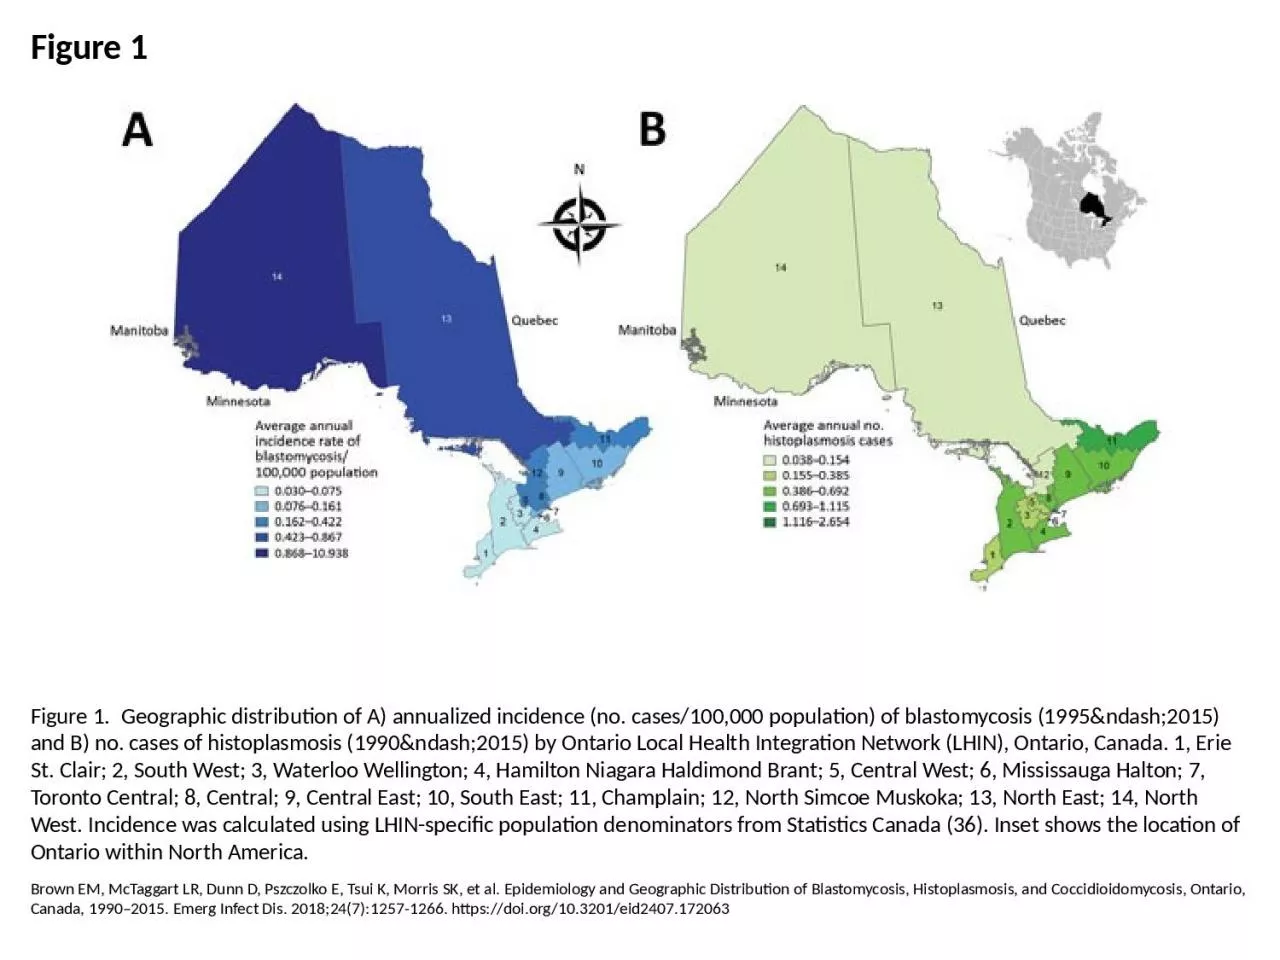
PPT-Figure 1 Figure 1. Geographic distribution of A) annualized incidence (no. cases/100,000
Author : gabriella | Published Date : 2024-01-13
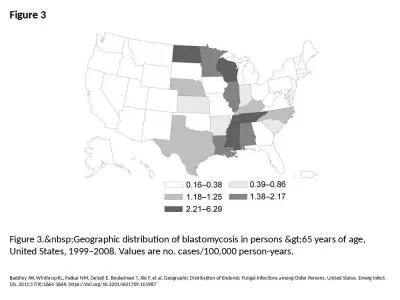
Brown EM McTaggart LR Dunn D Pszczolko E Tsui K Morris SK et al Epidemiology and Geographic Distribution of Blastomycosis Histoplasmosis and Coccidioidomycosis Ontario
Presentation Embed Code
Download Presentation
Download Presentation The PPT/PDF document "Figure 1 Figure 1. Geographic distribut..." is the property of its rightful owner. Permission is granted to download and print the materials on this website for personal, non-commercial use only, and to display it on your personal computer provided you do not modify the materials and that you retain all copyright notices contained in the materials. By downloading content from our website, you accept the terms of this agreement.
Figure 1 Figure 1. Geographic distribution of A) annualized incidence (no. cases/100,000: Transcript
Download Rules Of Document
"Figure 1 Figure 1. Geographic distribution of A) annualized incidence (no. cases/100,000"The content belongs to its owner. You may download and print it for personal use, without modification, and keep all copyright notices. By downloading, you agree to these terms.
Related Documents