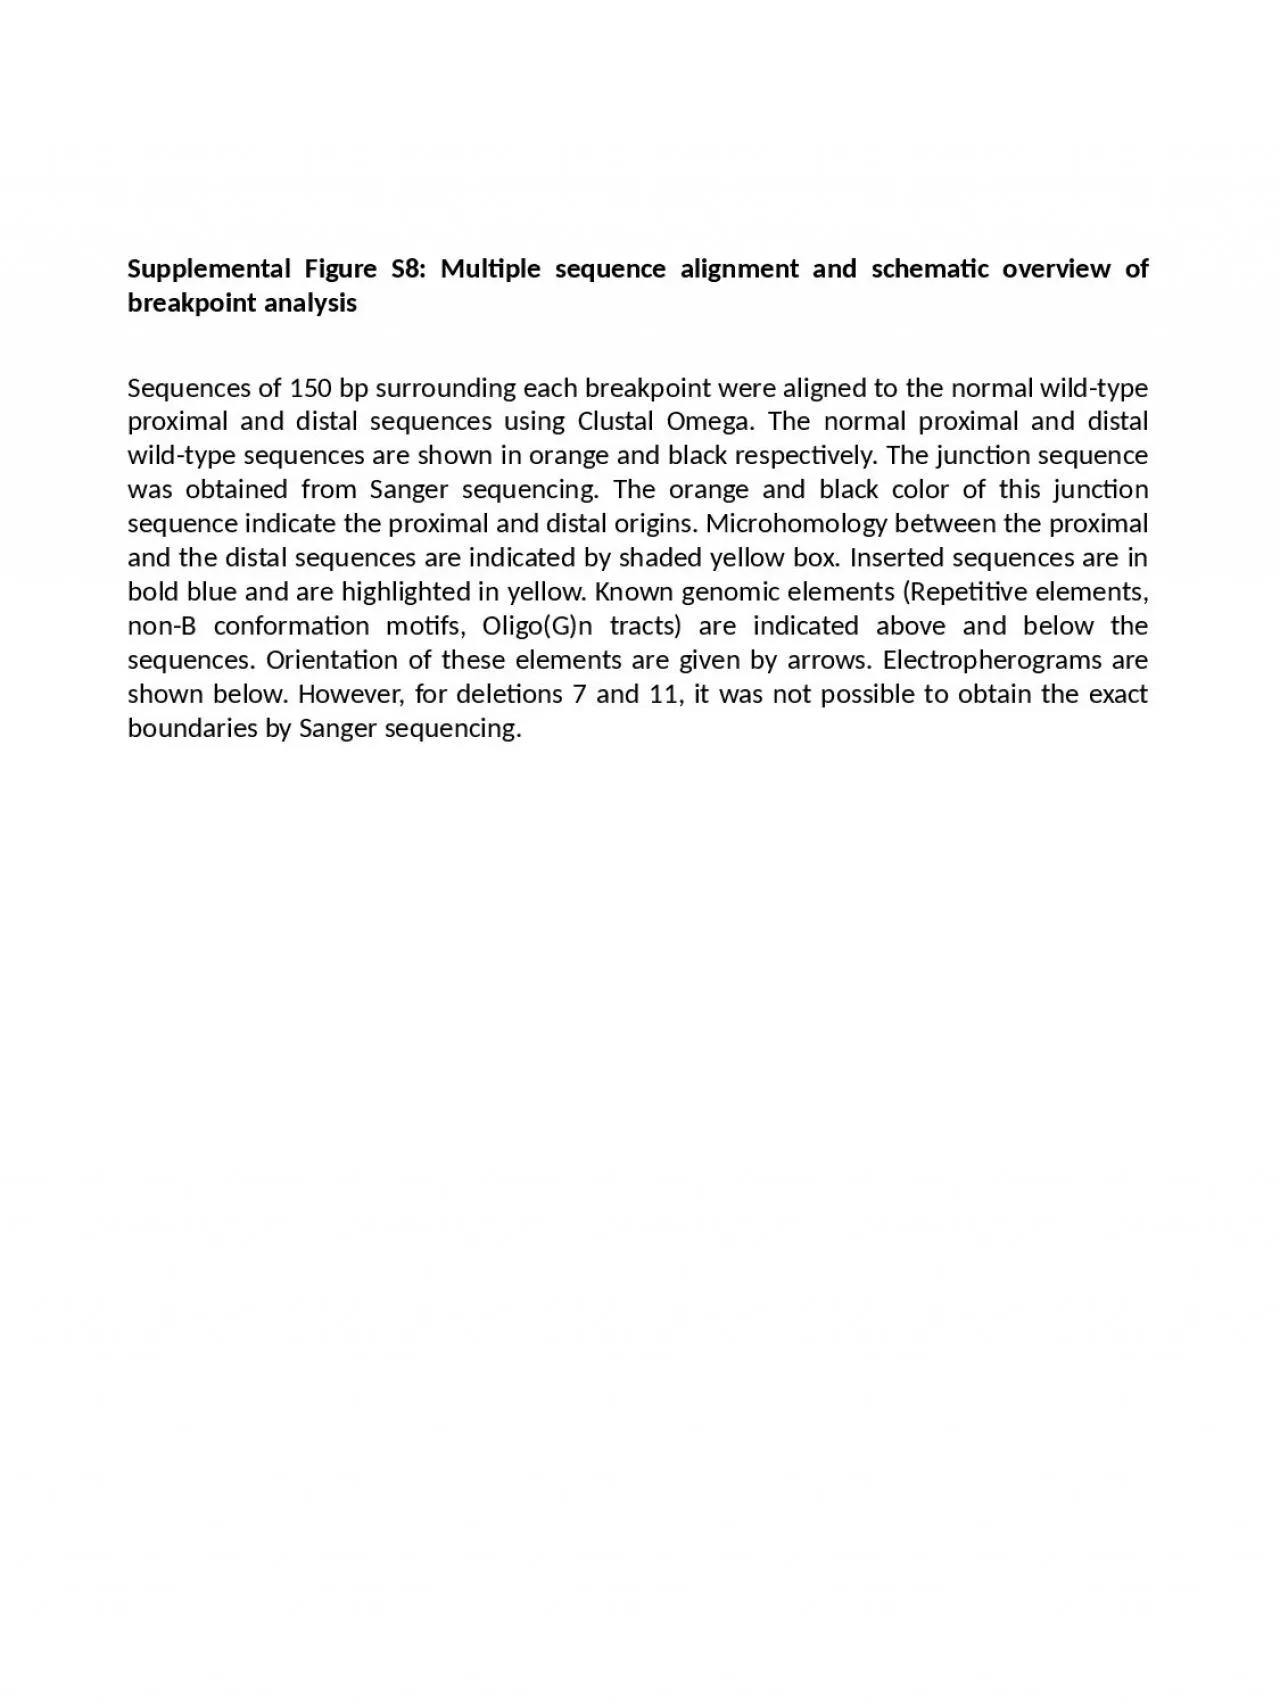
PPT-Supplemental Figure S8: Multiple sequence alignment and schematic overview of breakpoint
Author : garcia | Published Date : 2023-07-28
Sequences of 150 bp surrounding each breakpoint were aligned to the normal wildtype proximal and distal sequences using Clustal Omega The normal proximal and distal
Presentation Embed Code
Download Presentation
Download Presentation The PPT/PDF document "Supplemental Figure S8: Multiple sequenc..." is the property of its rightful owner. Permission is granted to download and print the materials on this website for personal, non-commercial use only, and to display it on your personal computer provided you do not modify the materials and that you retain all copyright notices contained in the materials. By downloading content from our website, you accept the terms of this agreement.
Supplemental Figure S8: Multiple sequence alignment and schematic overview of breakpoint: Transcript
Sequences of 150 bp surrounding each breakpoint were aligned to the normal wildtype proximal and distal sequences using Clustal Omega The normal proximal and distal wildtype sequences are shown in orange and black respectively The junction sequence was obtained from Sanger sequencing The orange and black color of this junction sequence indicate the proximal and distal origins Microhomology between the proximal and the distal sequences are indicated by shaded yellow box Inserted sequences are in bold blue and are highlighted in yellow Known genomic elements Repetitive elements nonB conformation motifs OligoGn tracts are indicated above and below the sequences Orientation of these elements are given by arrows Electropherograms are shown below However for deletions 7 and 11 it was not possible to obtain the exact boundaries by Sanger sequencing . Jia. -Ming Chang, Paolo Di . Tommaso. , and Cedric . Notredame. TCS. : A new multiple sequence alignment reliability measure to estimate alignment accuracy and improve phylogenetic tree . reconstruction, . p730 - 735. Essential Questions. How does the wiring in a circuit change its ability to supply power to devices?. How do we represent physical circuit elements in schematic drawings?. Objective(s. ): . Utah State University – Spring . 2012. STAT 5570: Statistical Bioinformatics. Notes 6.1. 2. References. Chapters 2 & 7 of Biological Sequence Analysis (Durbin et al., 2001). . 3. Review. Genes are:. and Sequence Profiles. Multiple sequence alignment. Generalize our pairwise alignment of sequences to include . more than two. homologous proteins.. Looking at more than two sequences gives us . much more information. The linear comparison of more than two sequences. Places residues in columns . per . position specific similarity scores . reflects . relationships . of the . sequences. the scores are based on . Tandy Warnow. Departments of Bioengineering and Computer Science. http://. tandy.cs.illinois.edu. O. r. a. ngut. a. n. G. orilla. Chimpanze. e. H. uma. n. F. r. om . the. . T. r. ee. . of. . the. L. Maya Schushan. November 2010. Outline- introduction to alignments. 1. . Introduction. 4. Pairwise Alignment:. Smith-Waterman. Needlman-Wunch. 5. Multiple Sequence Alignment:. ClustalW. MUSCLE. T-coffee. Supplemental Figure 1 Supplemental Figure 2 Supplemental Figure 3 Supplemental Figure 4 Supplemental Table 1 Supplemental Figure 5 fpkm. ). PD-L1 (. fpkm. ). CD8 (. fpkm. ). Iba1 (. fpkm. ). p. < 0.001. p. < 0.001. p. < 0.001. p. < 0.001. GM-CSF. GM-CSF. GM-CSF. GM-CSF. Supplemental Figure 1. Gene expression analysis in breast cancer cases from TCGA database. Gene expression levels of CD8, Iba1, PD-L1, and PD-L2 in breast cancer were compared between the cases with and without GM-CSF expression. The Mann-Whitney . Yu He. 04/13/2016. Adapted from the multiple sequence alignment presentations . by . Mingchao. . Xie. and Julie Thompson. Last update: 08/09/2021. Multiple sequence alignments. Multiple Sequence Alignment . ClustalW. Note. : EBI has retired the ClustalW service; see the new presentation "Generating Multiple Sequence Alignments with Clustal Omega" . ClustalW: . creating a multiple sequence alignment. You identify sequences to align. GSE47460_GPL14550 . GSE47460_GPL6480 . Supplemental Figure 2. Megakaryocyte score. Platelet score. FVC. DLCO. A. B. Megakaryocyte score. Platelet score. FVC. DLCO. r = -0.09331, p = 0.5237. r = 0.07781, p = 0.6721. Viral infection. Inflammation response. -log10(. p. -value) -log10(. the role of gene duplication followed by loss of function in speciation. For Friday, go through the slides from class 11. Aligning sequences is part of many analytical pipelines . Alignments can be local or global.
Download Document
Here is the link to download the presentation.
"Supplemental Figure S8: Multiple sequence alignment and schematic overview of breakpoint"The content belongs to its owner. You may download and print it for personal use, without modification, and keep all copyright notices. By downloading, you agree to these terms.
Related Documents