/
Looking Backwards, Looking Forward Looking Backwards, Looking Forward

Looking Backwards, Looking Forward - PowerPoint Presentation

gelbero
gelbero . @gelbero
Follow
65 views
Uploaded On 2023-11-03

Looking Backwards, Looking Forward - PPT Presentation

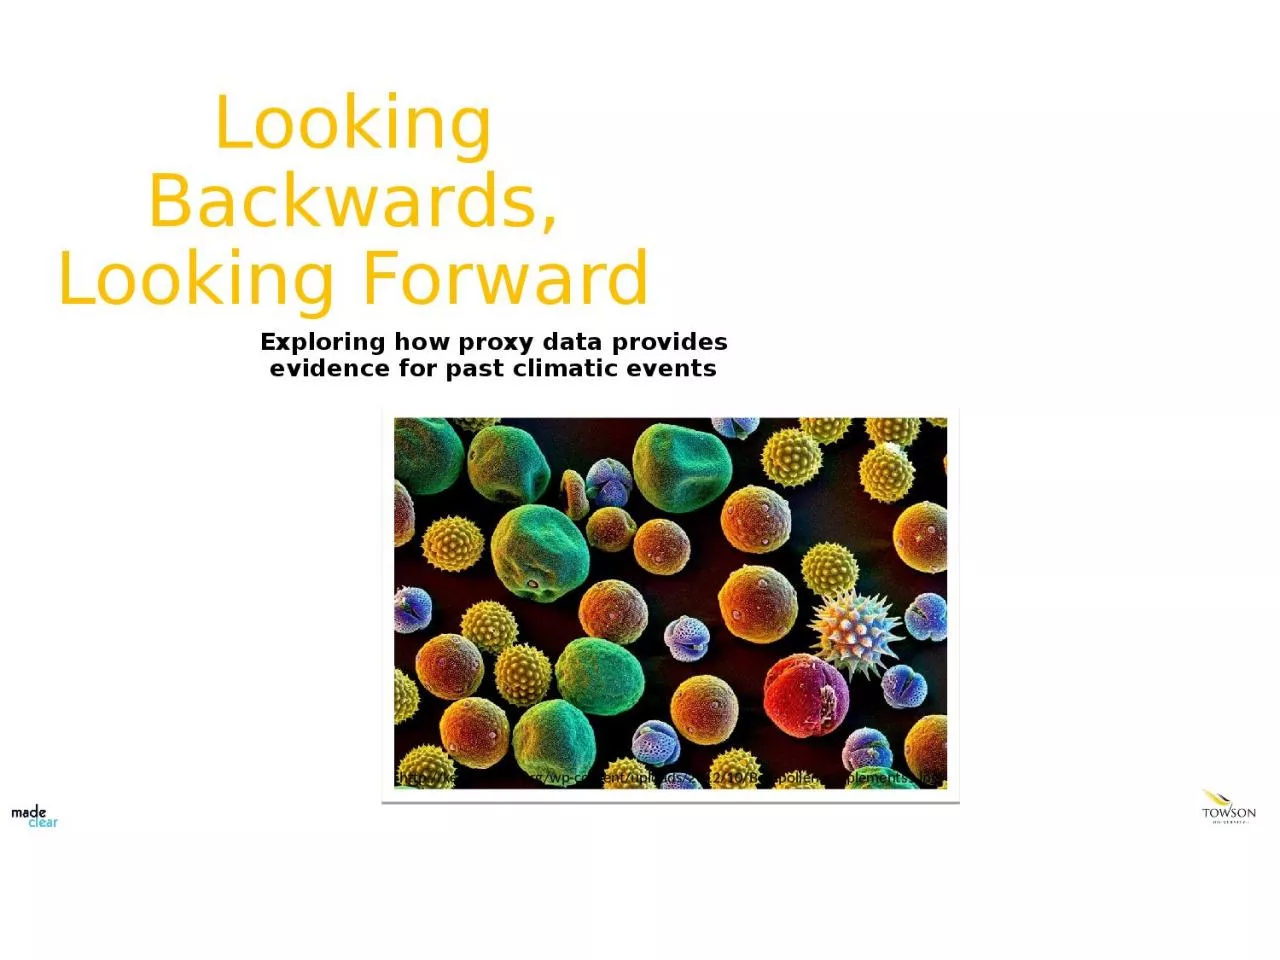
Exploring how proxy data provides evidence for past climatic events httpkeepingbeeorgwpcontentuploads201210Beepollensupplements1jpg Write down 3 observations for the cartoon Observations are what you can detect with your five senses ID: 1027944

data climate scientists pollen climate data pollen scientists group 500 sediment change scientific years observations 000 science anacostia answer

Share:

Link:

Embed:

Download Presentation from below link

Download Presentation The PPT/PDF document "Looking Backwards, Looking Forward" is the property of its rightful owner. Permission is granted to download and print the materials on this web site for personal, non-commercial use only, and to display it on your personal computer provided you do not modify the materials and that you retain all copyright notices contained in the materials. By downloading content from our website, you accept the terms of this agreement.


Presentation Transcript

1. Looking Backwards, Looking ForwardExploring how proxy data provides evidence for past climatic eventshttp://keepingbee.org/wp-content/uploads/2012/10/Bee-pollen-supplements1.jpg

2. Write down 3 observations for the cartoon. Observations are what you can detect with your five senses.

3. Student Responses…

4. Observation is what you can detect with your five sensesInference is a conclusion reached based on evidence (including observations) and reasoning. Observation: There is a hole in the container.Observation: The fish is holding a long object.Observation: The fish’s eyes are wide.Inference: The fish hit a baseball through the glass bowl.Inference: There fish is holding a baseball bat.Inference: The fish is surprised and worried.

5. Examine your initial ‘observations’. Are any of them inferences? Label any that are inferences, not observations.

6. Do you think scientists make observations and inferences like you did? Why do they make observations and inferences?Scientists use observation and inference to understand how the world works and make sense of scientific phenomena.

7. Today you will be working as a paleoclimatologist to explore what the Earth’s past climates were like.What was the climate like in the Anacostia watershed over the past 12,500 years?A paleoclimatologist is a scientist who studies past climates.

8. What does this video show?https://youtu.be/gEFFeAA3MN4

9. Weather and Climate are not the same thingWeather is what happens on a short-term basisClimate is the long-term average of weatherClimate is what you expect, weather is what you get!

10. The video showed evidence that the earth has been warming since 1884.

11. How do scientists know what the earth was like in the past if they weren’t around to see it or if there are no records?Do a think-pair-share with someone sitting near you and discuss this question.

12. …Student ideasHow do scientists know what the earth was like in the past if they weren’t around to see it or if there are no records?

13. Scientists make inferences based on observations.How do scientists know what the earth was like in the past if they weren’t around to see it or if there are no records?

14. Proxy Data for ClimateProxy data are reserved physical characteristics of an environment that serve as indirect ways of getting information about a past environment.Can you think of sources scientists might use as proxy climate data?

15. Proxy Data for Climatehttp://www.bibliotecapleyades.net/imagenes_ciencia/asteroids_comets70_01.jpghttp://www.treeringpens.com/tree-ring-science/http://earthobservatory.nasa.gov/Features/Paleoclimatology_CloseUp/Images/coral_core_drilling.jpghttp://www.thenakedscientists.com/forum/index.php?topic=12824.0Preserved physical characteristics of an environment that serve as indirect ways of getting information about a past environment.http://www.nps.gov/lake/learn/nature/images/Sediment-Core.jpgIce cores can tell scientists about temperature, precipitation, atmospheric conditions, oceanic activity and wind patterns. Because climate conditions influence tree growth, patterns in tree-ring widths, density, and isotopic composition reflect variations in climate.Data from coral skeletons provide information about water temperature during the time the coral was growingSediment from lakes and ocean contains lots of clues about past climate in the forms of fossils and chemicals.Preserved pollen grains that were produced by plants thousands of years ago can tell scientists about past climate conditions. https://www.ncdc.noaa.gov/news/what-are-proxy-data

16. Why are data important in science?

17. Why are data important in science?Scientists rely on data to provide evidence to support their claims. Data and evidence are critical in science.

18. Form expert groups for background researchWhat is pollen and how is it distributed? What are sediment cores and how are they used by scientists?How do plant communities reflect local climate and climate change?How are proxy data used to learn about past climate?

19. Placemat Graphic OrganizerPollenPlant Communities and ClimateSediment CoresClimate Proxy DataHow can we infer past climates from the plants that were growing in an area?

20. Expert GroupsPollen… Plant Communities and Ecosystems…Sediment Cores…Proxy Data…

21. Form sharing groups to answer Challenge QuestionMake sure to include information in your answer from each of the topics represented by your experts on:PollenPlant CommunitiesSediment CoresProxy DataHow can we infer past climates from the plants that were growing in an area?

22. Sharing GroupsGroup 1… Group 2…Group 3…Group 4…Group 5…Group 6…

23. https://researcherridge2014.wordpress.comDartmouth Electron Microscope Facility, Dartmouth CollegeFrode JacobsenG. BrushPlant Communitieshttps://biomesfirst10.wikispaces.com/Temperate+Deciduous+Forest+Homehttps://sites.google.com/site/roxym304/_/rsrc/1397797367372/hon-biology-units/unit-9---ecolosystems/tropical-rainforest-https://biomesfirst10.wikispaces.com/Temperate+Deciduous+Forest+HomeHow can we infer past climates from the plants that were growing in an area? https://researcherridge2014.wordpress.comDartmouth Electron Microscope Facility, Dartmouth CollegeFrode Jacobsen

24. What was the climate like in the Anacostia Watershed over the past 12,500 years?Forested floodplain on Indian Creek, a tributary of Anacostia River in Prince George’s County, MarylandArea is currently 100 acres of wetlandClick on image above to access interactive Google map

25. Getting the sediment core sampleGo into the field and drill a sediment core sampleBring sample back to lab and cut into thin slices, each representing a piece of geological timeChemically treat each sample so to filter out the very tiny grains of pollenIdentify each pollen grain so they could determine which types of plant were present thousands of years in the past0 – 340ybp3,400 – 6,000ybp6,000 – 11,000 ybp11,000 – 12,500 ypbThis end was closest to surfaceThis end was the deepest.Data adapted from Yuan, 1995.http://www.ams-samplers.com/media/catalog/category/multi-stage-sludge-sampler-use-2.jpghttp://schmidtocean.org/wp-content/uploads/2012-11-09-dnm-pushcoreupclose-768x512.jpghttp://www.lpc.uottawa.ca/resources/Pollen%20heavy%20liquid%20pics/vortex.bmphttp://iansa.eu/papers/IANSA-2012-02-bernardova-web-resources/image/5609.pnghttps://ferrebeekeeper.files.wordpress.com/2010/04/pollen-header.jpg

26. Examining a 12,500 year pollen sediment coreSlice 4: ~340 ybpSlice 3: ~3,000 ybpSlice 2: ~10,000 ybpSlice 1: ~11,900 ybpThis is a reminder that you have registered to attend a focus group to discuss the next generation mobile laboratory currently under development at MdBio Foundation.DATE:  February 4, 2016TIME:  4:00 – 6:00PMLOCATION:  WSSC, 14501 Sweitzer Ln, Laurel, MD 20707Parking:  There is parking available at the WSSC buildingUpon arrival:  Please visit the security guard in the main lobby, provide your name and tell them you are on site for the MdBio Foundation educator focus group.  You may need to provide identification.  The guard will direct you to the correct floor and room location.Dinner:  A light dinner will be served during the meeting.Focus group participants will be asked to provide ideas, guidance and expertise on a variety of issues, including content area selection, curriculum and activities, target audiences, logistics and details, marketing, outreach and future educational needs.Thank you for your insight as we build the next generation mobile laboratory to serve Maryland schools.  Your input is valuable and we appreciate you joining us.  If you have any questions or are unable to attend please reply to this email or call/text me at 410.570.8814.This end was closest to the surfaceWhat does “ybp” stand for?This end of the sediment core was the deepest.This end of the sediment core was closest to the surface.1234

27. You’re going to examine a model of a sediment core.1 bead represents a pollen grain from a specific taxon (type of plant) in your sample.Dartmouth Electron Microscope Facility, Dartmouth College

28. What was the climate like in the Anacostia Watershed over the past 12,500 years?Forested floodplain on Indian Creek, a tributary of Anacostia River in Prince George’s County, MarylandArea is currently 100 acres of wetland

29. Collecting Pollen DataEach group is being assigned a sample from one slice of the sediment core:What type of information will you need to collect? As a group, create a table on your white board where you will write you data. Sort though your sediment sample for pollen, and fill in your data table on your white boardCalculate the percentage of each type of pollen in your sampleAdd your percentages of pollen to the class data setSlice 4: ~340 ybpSlice 3: ~3,000 ybpSlice 2: ~10,000 ybpSlice 1: ~12,500 ybp1234

30. Bead ColorPollen Taxa% Pollen~340 ybp% Pollen~3,000 ypb% Pollen~10,000 ypb% Pollen~12,500 ypbredAlderwhiteBirchyellowFirgreenHemlockblackOakbrownPineblueRagweedpurpleSedgesorangeSprucepinkViburnumClass Data Table. If more than one group collected data for a time period, record the average of the two groups.

31. Graphing the DataMake a graph of the percentage of each pollen species for each time period (you will be making 4 graphsIn order to facilitate comparison later make sure to do the following:Arrange the taxa along the x-axis in alphabetical orderLeave a space for all taxa, even if none were countedUse a common scale (0% – 50%) on the y-axis

32. What do you need to do next to be able to answer your question?What was the climate like in the Anacostia Watershed over the past 12,500 years?

33. Look for patterns in your data to answer the question.Use the Plant Characteristics Table if you need more information about the preferred climate of each taxon.Consider the following:Which taxon are most represented in your sample? Which taxon are NOT represented in your sample? Are the percentages of specific taxa going up or down through time?What type of climate does each taxon do best in? Wet? Dry? Cold? Hot?Data analysis and interpretationWhat was the climate like in the Anacostia Watershed over the past 12,500 years?

34. Scientific ArgumentEach person in your group needs to write a scientific argument (a claim, supported by evidence and reasoning) about what the climate was over the past 12,500 years in the Anacostia watershed.You can ask your group members for help, but you must write your own scientific argument.Claim: Answer to the question What was the climate like in the Anacostia watershed over the past 12,500 years?Evidence: The data that support your claim. Must be appropriate and sufficient.Reasoning: Explains how the data support the claim. Includes scientific principles.

35. Scientific Argument Peer ReviewYou will be paired up with a person from another group.You will compare your responses and critique your own scientific explanations.Use the rubric provided to assess your CER.

36. Scientific Argument Peer ReviewUsing the feedback from your peer review session, revise your scientific explanation about what the climate was like in this region over the past 12,500 years.

37. An important aspect of science is identifying and explaining patterns in nature. Explain why this is important for scientists to do, using an example from your climate investigation.

38. An important aspect of science is identifying and explaining patterns in nature. Explain why this is important for scientists to do, using an example from your climate investigation. Science assumes that objects and events in natural systems occur in consistent patterns that are understandable through measurement and observation. By studying these patterns, scientists can understand how the natural world works. By understanding past patterns of climate change, scientists are able to develop a better understanding of current causes of climate change.

39. Does all science require controlled experiments? Provide specific examples from this activity to support your answer.

40. Does all science require controlled experiments? Provide specific examples from this activity to support your answer. Not all scientific knowledge comes from controlled experiments. For example, in astronomy scientists cannot manipulate planets or star but they are still able to make observations and inferences and learn about how the universe works. In the work we have been doing with pollen and climate, we did not create a controlled experiment. Rather, we made observations and inferences of data from different time periods to infer what past climates were like.

41. Climate Change Past and PresentRead the passage on pages S7-S8 in your student hand-out. Answer the Discussion Questions

42. Why is our climate changing so quickly now?

43. What are the effects of the fast rate of climate change we are currently experiencing?

44. How would you respond if you heard someone say…I heard that the climate has changed before and this current climate change we are talking about is just like that. So we don’t have to be worried. It’s the same thing.

45. How is current climate change different than past climate change?Our climate is changing at a much faster rate than even before!This change is due to humans releasing CO2 into the atmosphere. This is a problem because a changing climate results in:Increasing sever weather eventsAffects how we grow and produce food

46. What can we do about Climate Change?Reduce our Carbon Footprints by:Using less energyDrive lessUse less electricityReduce, reuse and recycleDevelop alternative sources of fuelWindSolarAlgae-based fuelsEtc….