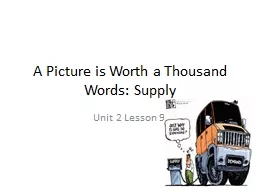
/
A Picture is Worth a Thousand Words: Supply A Picture is Worth a Thousand Words: Supply

A Picture is Worth a Thousand Words: Supply - PowerPoint Presentation

giovanna-bartolotta
giovanna-bartolotta . @giovanna-bartolotta
Follow
366 views
Uploaded On 2018-03-18

A Picture is Worth a Thousand Words: Supply - PPT Presentation

Unit 2 Lesson 9 Why do producers offer goods and services for sale Producers wish to earn money or even take pride in providing a good or service that other people find valuable enough to buy The relationship between price and the quantity producers are willing to produce is depicted by a supp ID: 655817

producers supply quantity shift supply producers shift quantity price schedule

Share:

Link:

Embed:

Download Presentation from below link

Download Presentation The PPT/PDF document "A Picture is Worth a Thousand Words: Sup..." is the property of its rightful owner. Permission is granted to download and print the materials on this web site for personal, non-commercial use only, and to display it on your personal computer provided you do not modify the materials and that you retain all copyright notices contained in the materials. By downloading content from our website, you accept the terms of this agreement.


Presentation Transcript

Slide1

A Picture is Worth a Thousand Words: Supply

Unit 2 Lesson 9Slide2

Why do producers offer goods and services for sale?

Producers wish to earn money or even take pride in providing a good or service that other people find valuable enough to buy.

The relationship between price and the quantity producers are willing to produce is depicted by a supply schedule.

As the price rises, producers are willing, for most goods and services, to produce more.Slide3

How Many Hours Are You Willing to Work?

You have decided that you need to earn more money. You are considering applying for a part-time job. Describe the abilities you have that you think will influence the wage rate employers will offer you.

Knowledge

Attitudes

SkillsSlide4

List the number of hours that you are willing to work per week at each of the hourly rates of pay in the column below. Assume a seven-day week, and remember that you must still attend school.

Hourly Pay

Hours Willing to Work

$1.00


$5.00


$7.00


$10.00 $15.00 $20.00 $25.00 $100.00 Slide5

Hours Willing to Work for 1 Week

Hourly Pay

Student 1

Student 2

Student 3

Student 4

Total

$1.00

$5.00

$7.00$10.00$15.00$20.00$25.00$100.00Total _____________Slide6

Graph It! Supply of Hours to WorkSlide7

Summarization of the Law of Supply

As prices for goods or services rise, the

quantity

people are willing and able to supply rise.

As prices for goods and services fall, the

quantity

people are willing and able to supply decreases. Slide8

How do selected determinants of supply shift the supply schedule?

With your shoulder partner read “

The Amazing Farmer Jones

” and complete questions A and B.

Why did so many farmers leave farming to go into other careers?

Better alternatives, low market value for their crops, prospect of increased competition from foreign producers of food products, high equipment costs, and taxes.

When many producers leave a market (as in the case of farming), what is likely to happen to the quantity produced at any given price?

That quantity will fall. The falling quantity is pictured by a supply curve that has shifted to the left. The whole price-quantity relationship or supply curve moves on the graph. This shift occurs because one of the determinants of supply (the number of sellers) has changed. When a determinant changes, the whole supply picture changes.Slide9

Indicate with a show of hands (raise the right hand to indicate a shift of supply to the right-an increase; raise the left hand to indicate a shift of supply to the left-a decrease) what will happen to supply in the following circumstances:

The supply of cars when open-trade agreements bring in new producers.

Shift right; increase in producers.

The supply of coffee when freezing temperatures hit the major coffee-producing regions of Brazil and Costa Rica.

Shift left; natural disaster decreases inputs.

The supply of lumber when a new computer-assisted saw reduces the cost of lumber production.

Shift right; new technology decreases production costs.

The supply of gasoline today if there is an expected shortage and higher prices likely to occur next week.

Shift left; sellers want higher future prices, so they will decrease their supply today.Slide10

Closure

Objectives

Create a visual to explain how price changes affect the quantity producers are willing and able to supply.

P S

P S

Graph an example of a producer supply schedule on a coordinated axis system.

Concepts

Determinants of Supply-

Factors other than price that change (shift) the supply schedule, causing producers to supply more or less at every price. Factors include number of firms, production costs, and new technology.

Supply- A schedule (or graph) showing how many units of a good or service producers are willing and able to sell at all possible prices during a period of time.QSP