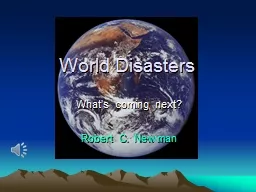
Directions Distribute the clues so that each person is holding at least one Clues 14 Black Death 58 Spanish Flu 910 Hurricane Katrina Share the clues in a roundrobin fashion putting each clue into one of the following piles ID: 687452
Download Presentation The PPT/PDF document "Economics of Disasters Are Disasters Goo..." is the property of its rightful owner. Permission is granted to download and print the materials on this web site for personal, non-commercial use only, and to display it on your personal computer provided you do not modify the materials and that you retain all copyright notices contained in the materials. By downloading content from our website, you accept the terms of this agreement.
Slide1
Economics of DisastersSlide2
Are Disasters Good for the Economy?
Directions:
Distribute the clues so that each person is holding at least one.
Clues #1-4: Black Death, #5-8: Spanish Flu, #9-10: Hurricane Katrina
Share the clues in a round-robin fashion, putting each clue into one of the following piles:
Relevant to solving the problem
Not helpful in solving the problem
Not sure
Answer the question:
ARE disasters good for the economy?
Determine the least # of clues necessary to answer the question.
Be prepared to defend your answer & clue selection. Slide3
KathySlide4
Are Disasters Good for the Economy?
NO !
NO! NO! NO! NO! NO! NO! NO!Slide5
Resources are limited
Resources are necessary for production
(output
ƒ
resources)
Disasters increase resource scarcity (disasters destroy land, labor &/or capital)
Output must be lower than it would have been had the disaster not occurred
Scarcity IS
GDPSlide6
Activity Clue #9:
J.P. Morgan senior economist Anthony Chan: "Preliminary estimates indicate 60 percent damage to downtown New Orleans. Plenty of cleanup work and rebuilding will follow in all the areas. That means over the next 12 months, there will be lots of job creation, which is good for the economy."
HUH?Slide7
Models: Tools of Economic Reasoning
Production Possibilities Frontier (PPF)
Assumptions of the Model:
All resources are used to produce the 2 categories of products on the X and Y axes
At all points on the curve, all resources are fully employed, given the available technology. (we choose from the possibilities)
goods
services
xSlide8
Models: Tools of Economic Reasoning
Production Possibilities Frontier (PPF)
Assumptions of the Model:
Technological improvements or the discovery of new resources makes more production possible. The curve moves “out,” to the right.
Destruction of resources or technology makes less production possible; the curve moves “in” and “down,” to the left.
services
goodsSlide9
Terminology &
Measurement
What do we mean by “the economy
” ?
H
ow are we measuring it?
output
= real
GDP
well-being
” or standard of living = real
GDP/capita
economic
growth:
c
hange
in real GDP &/or real GDP/capita
levelrateSlide10
Real GDP/capita
Level
vs.
Rate
time
Real GDP/capita
timeSlide11
Economic Growth pre & post Disaster
Rate?
Level?
Q
D
Time
D
Output
trend
bottom
disaster
BSlide12
Economic Growth:
Rate?
Level?
Q
D
Time
D R
Output
trend
disaster recoverySlide13
Economic Growth:
Rate?Level?
When ?
Q
Time
Output
trendSlide14
Economic Growth:
Rate?Level?
When ?
Q
Time
Output
trendSlide15
Economic Growth Stimulus
NO Evidence for this Scenario
Q
Time
Output
old trend
new trendSlide16
Activity Clue #9:
J.P. Morgan senior economist Anthony Chan: "Preliminary estimates indicate 60 percent damage to downtown New Orleans. Plenty of cleanup work and rebuilding will follow in all the areas. That means over the next 12 months, there will be lots of job creation, which is good for the
economy
."
????Slide17
GDP v. GDP/capita
Productivity
:
output per unit of input
ƒ
{ human capital, physical capital }
skills & talents
education
training
buildings
machines & tools
technologySlide18
Labor Productivity:
output per person-hour
services
goods
Effect of population change in economy with little capital
pop. growth
ƒ {availability of capital}
services
goods
pandemicSlide19
labor-intensive
products
capital-intensive product
s
capital-intensive products
labor intensive products
capital to labor ratio falls
capital to labor ratio rises
Capital to Labor RatioSlide20
labor-intensive
products
capital-intensive product
s
capital-intensive products
labor intensive products
capital to labor ratio falls
capital to labor ratio risesSlide21
labor-intensive
products
capital-intensive product
s
capital-intensive products
labor intensive products
capital to labor ratio falls
capital to labor ratio risesSlide22
labor-intensive
products
capital-intensive product
s
capital-intensive products
labor intensive products
capital to labor ratio falls
capital to labor ratio risesSlide23
labor-intensive
products
capital-intensive product
s
capital-intensive products
labor intensive products
capital to labor ratio falls
capital to labor ratio risesSlide24
labor-intensive
products
capital-intensive product
s
capital-intensive products
labor intensive products
capital to labor ratio falls
capital to labor ratio risesSlide25
labor-intensive
products
capital-intensive product
s
capital-intensive products
labor intensive products
capital to labor ratio falls
capital to labor ratio risesSlide26
Are Disasters Good for the Economy?
NO! NO! NO! NO! NO!
Resources are destroyed
Total output ( real GDP) falls
the PPF always shrinksSlide27
Why Might Disasters
SEEM To Be
Good for the Economy?
economic “well-being” -
standard of living (real GDP/capita)
When capital to labor ratios rise,
real GDP/capita may rise -
even as total real GDP falls
capital-intensive products
labor-intensive productsSlide28
Activity Clue #9:
J.P. Morgan senior economist Anthony Chan: "Preliminary estimates indicate 60 percent damage to downtown New Orleans. Plenty of cleanup work and rebuilding will follow in all the areas. That means over the next 12 months, there will be lots of job creation, which is good for the economy."
Questions to Ask:
Is this a credible source?
If so, are the standards for comparison specified?
(What are you measuring?)Slide29
DebbieSlide30
Frédéric Bastiat
“There is only one difference between a bad economist and a good one: the bad economist confines himself to the visible effect; the good economist takes into account both the effect that can be seen and those effects that must be foreseen.” Slide31
“What Is Seen and What Is Not Seen”
Economic Sophisms, 1845
“The Broken Window Fallacy”
Suppose James Goodfellow’s son breaks a window.Slide32
"It's an ill wind that blows nobody some good. Such accidents keep industry going. Everybody has to make a living. What would become of the glaziers if no one ever broke a window?"Slide33
. . . Suppose that it will cost six francs to repair the damage. . . . The glazier will come, do his job, receive six francs, congratulate himself, and bless in his heart the careless child.
That is what is seen.
But if, by way of deduction, you conclude, as happens only too often, that it is good to break windows, that it helps to circulate money, that it results in encouraging industry in general, I am obliged to cry out:
That will never do!
Your theory stops at
what is seen.
It does not take account of
what is
not seen
.”Slide34
It is
not seen
that if he had not had a windowpane to replace, he would have replaced, for example, his worn-out shoes or added another book to his library.
Let us next consider industry
in general.
The window having been broken, the glass industry gets six francs' worth of encouragement;
that is
what is seen.
If the window had not been broken, the shoe industry (or some other) would have received six francs' worth of encouragement;
that is
what is not seen
.Slide35
Frédéric Bastiat
. . .
Destruction is not profitable
.”Slide36
We know this has to be fishy just by asking: Would there have been even greater "economic good" had the terrorists succeeded in destroying buildings in Los Angeles, San Francisco, Chicago, Philadelphia, Boston and all other major cities? Of course, you and I know that is utter nonsense. Property destruction always lowers the wealth of a nation. I hope one of Krugman's students asks him, "If property destruction is good for the economy, why aren't Beirut and Belfast boom towns?
Walter Williams, George Mason University
http://www.jewishworldreview.com/cols/williams100401.asp
He Should Know Better:
"Ghastly as it may seem to say this, the terror attack . . . could do some economic good." [. . . destruction will stimulate the economy through business investment in rebuilding] .
Paul Krugman, Princeton University
New York Times, Sept. 14, 2001
Bastiat Hasn’t Been Forgotten:Slide37
"If property destruction is good for the economy, why aren't Beirut and Belfast boom towns?”
Slide38
Not
Everyone
Is Hurt By Disasters
Economic change creates winners
and
losers.
Fallacy of Composition: To erroneously assume that what is true of the
whole
is true of an
individual.Slide39
And the Winners Are . . .Slide40
When Disaster Strikes, What Can Markets Do?
Lesson 2:
Japanese
Tsunami
2011
Prices & information
Supply shocks
Consumption shocks
The Great
Chicago Fire
1871
Superstorm
Sandy
2012Slide41
Scarcity IS
Scarcity requires rationing – the question is not whether to ration, but which method of rationing to use addresses scarcity.
Review/Reminder: Why do we ration?
Guideline for choice among alternatives:
Which provides us with the greatest excess of benefits over costs?
(or, another way to say it is, “Which best addresses scarcity?”)Slide42
What markets do best:
Transmit information to decision-makers Direct resources to their most highly valued uses
Encourage the least-cost use of resources, including human time and effort
Why do we ration through markets?Slide43
Frederich von Hayek:
The essential task of economic systems: rapid adaptation to the changes in the particular circumstances of time and place
The nature of knowledge and information:
information about the particular circumstances of time and place is localized and widely dispersed,
Information & Knowledge
BUT, unlike central planners,
economic decision-makers in markets only
need
SOME
of that informationSlide44
“Assume that somewhere in the world a new opportunity for the use of some raw materials, say tin, has arisen, or that one of the sources of supply of tin has been eliminated. It does not matter . . . which of these two causes has made tin more scarce. All that the users of tin need to know is [what the higher
price
tells them—]
Prices transmit information
The whole acts as one market, not because any of its members survey the whole field . . . [but because] individual fields of vision sufficiently overlap so that through many intermediaries the relevant information is communicated to all.”Slide45
1 vs. 100
FTE - StyleSlide46
Information in Disaster: Who Knew?
Relief work clearing debris and reaching coastal communities in Banda Aceh was delayed until
what
could be acquired after the 2004 Asian tsunami?Slide47
Information in Disaster: Who Knew?
If you had been in charge of setting up a survivor daily-supply store after Hurricane Katrina, what 3 items would you have stocked?Slide48
Information in Disaster: Who Knew?
If you had been in charge of taking care of displaced pets after Hurricane Rita, what non-food item would you have taken to Houston in your supply truck?Slide49
Information in Disaster: Who Knew?
What relief item is most likely to be oversupplied after a disaster? Slide50
Information in Disaster: Who Knew?
5. You’re in charge of emergency medical care in Haiti. What piece of equipment will you need to function in this impoverished undeveloped country?Slide51
Information in Disaster: Who Knew?
6.
You’re in charge of helping people who need to communicate with friends and relatives after Hurricane Sandy. What equipment will meet immediate needs until infrastructure can be repaired?Slide52
http://www.youtube.com/watch?v=R6ojYtKazgQSlide53
KathySlide54
Disasters destroy resources.
Less can be produced; output falls.Price rises.
Quantity purchased falls.
Models: Tools of Economic Reasoning
$
P
Q
S
after
S
before
D
before & after
Market Analysis: Supply ShockSlide55
Higher prices have 2 effects:
Consumers buy less. (They substitute.)Producers offer more for sale. (They also substitute.)
Models: Tools of Economic Reasoning
$
P
Q
S
after
S
before
D
before & after
Market Analysis: Supply Shock
Question:
In a disaster, is this a good thing or a bad thing?Slide56
Disasters destroy resources.
Demand shifts because of changes in the prices of substitutes. (ice for refrigeration, for example)
Price rises.Greater quantity (of ice) is offered for sale.
Models: Tools of Economic Reasoning
$
P
Q
D
after
D
before
S
before & after
Market Analysis: Consumption ShockSlide57
Higher prices have 2 effects:
Consumers buy less. Producers offer more for sale.
Models: Tools of Economic Reasoning
$
P
Q
D
after
D
before
S
before & after
Market Analysis: Consumption Shock
Question:
Is that a bad thing for disaster victims?
(in general? individually?)
2
nd
Question:
If it is, what can be done to help them?Slide58
Profit is the motivator: Markets don’t wait for disasters; they prepare.
State Farm Insurance
Wal-Mart
Home Depot
Fed-Ex
Black & Decker
Disaster-preparedness industry – because there’s profit in doing so.Slide59
Case Studies in Lesson 2
The housing market after the Great Chicago Fire of 1871Wal Mart, Home Depot, & State Farm Insurance after Hurricane KatrinaMarket allocation of gasoline after Hurricane Katrina Slide60
The Gasoline Market Responded to Sandy: “
Disasterpreneurs”
http://lfb.org/the-gas-price-story-of-hurricane-sandy/
“The Gas Price Story of Hurricane Sandy”:
Markets emerge, even when you try to stop them. And they work.Slide61
The Gasoline Market Responded to Sandy: “
Disasterpreneurs”
video
http://www.youtube.com/watch?v=USG7j8bP_l4
Thru 7:30
article
http://lfb.org/today/the-gas-price-story-of-hurricane-sandy/
Slide62
Markets can do what they do best – whether there is a disaster or not:communicate information about relative scarcities
use price signals to allocate goods, services, and resources to their most highly valued uses(What about “price-gouging”? Activity this afternoon.)
What Can Markets Do in Disasters?
Caveat:
Markets can only do what they do best
IF
the rules of the game allow them to do so.
. . . Lesson 3Slide63
Market for Thing-a-ma-jigsSlide64
BUYERS Goal: PROFIT
Each buyer will have only one buyer card at a time. The card will allow you to buy ONE thingamajig and will tell you how much you value it. To make a “profit,” buy at a price lower than the price shown on your card. If you buy at a higher price, you suffer a loss.
DO NOT REVEAL THE PRICE.
Record the buyer card price on your student score sheet. When the round starts, try to buy below your buyer-card price – the lower, the better.
(You may buy at a price higher than that on your buyer card, but note that this will reduce your “profit” for the round.) When you make a purchase, record the transaction price on your score sheet. Then, turn in the buyer card and get another buyer card from the buyer pile.
How to Play…Slide65
Sellers Goal: PROFIT
At the beginning of each round, each seller will be given an inventory of Thingamajigs and a role card with the cost per thingamajig. To make profit, sell at a price higher than the cost. If you sell at a lower price, you suffer a loss.
DO NOT REVEAL THE PRICE.Record the seller card price on your student score sheet.
How to Play…Slide66
BUYERS & SELLERS
All stores are open to all buyers. When a buyer and seller agree on a price, they record the transaction on their transaction records, and the seller gives the Thingamajig to the buyer.
The BUYER must then report the transaction by turning in the Thingamajig card to the person keeping the Market Tally in the front of the room. The buyer may then exchange his buyer card for another and try to make another purchase.
How to Play…Slide67
BUYERS & SELLERS
When the teacher says “Start,” sellers and buyers are free to move around the room and to make transactions with one another. Any seller may talk with any buyer.Both buyers and sellers are free to make as many transactions as they want in a round. Buyers, remember to turn in your Thingamajig card to the tally keeper and get a new buyer card after each transaction.
During the game, keep track of your progress on the student score sheet. Compute your gains and losses by taking the difference between the price on your buyer or seller card and the price of the transaction.
How to Play…Slide68
Let’s Play!ROUND 1Slide69
Let’s Play!ROUND 1
ROUND 2 ROUND 3ROUND 4 Slide70
Transaction TallySlide71
LearnLiberty:
Is Price Gouging Immoral? Should It Be Illegal?
http://www.learnliberty.org/videos/price-gouging-immoral-should-it-be-illegal/