/
Multi-faceted Classification of Big Data Uses and Proposed Architecture Integrating High Multi-faceted Classification of Big Data Uses and Proposed Architecture Integrating High

Multi-faceted Classification of Big Data Uses and Proposed Architecture Integrating High - PowerPoint Presentation

giovanna-bartolotta
giovanna-bartolotta . @giovanna-bartolotta
Follow
350 views
Uploaded On 2018-10-22

Multi-faceted Classification of Big Data Uses and Proposed Architecture Integrating High - PPT Presentation

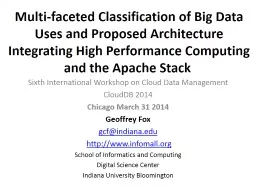
Sixth International Workshop on Cloud Data Management CloudDB 2014 Chicago March 31 2014 Geoffrey Fox gcfindianaedu httpwwwinfomallorg School of Informatics and Computing ID: 693015

analytics data mapreduce big data analytics big mapreduce hpc learning parallel application high hadoop requirements communication large nist processing

Share:

Link:

Embed:

Download Presentation from below link

Download Presentation The PPT/PDF document "Multi-faceted Classification of Big Data..." is the property of its rightful owner. Permission is granted to download and print the materials on this web site for personal, non-commercial use only, and to display it on your personal computer provided you do not modify the materials and that you retain all copyright notices contained in the materials. By downloading content from our website, you accept the terms of this agreement.


Presentation Transcript

Slide1

Multi-faceted Classification of Big Data Uses and Proposed Architecture Integrating High Performance Computing and the Apache Stack 

Sixth International Workshop on Cloud Data ManagementCloudDB 2014Chicago March 31 2014

Geoffrey

Fox

gcf@indiana.edu

http://www.infomall.org

School of Informatics and Computing

Digital Science Center

Indiana University BloomingtonSlide2

Abstract

We introduce the NIST collection of 51 use cases and describe their scope over industry, government and research areas. We look at their structure from several points of view or facets covering problem architecture, analytics kernels, micro-system usage such as flops/bytes, application class (GIS, expectation maximization) and very importantly data source. We then propose that in many cases it is wise to combine the well known commodity best practice (often Apache) Big Data Stack (with ~120 software subsystems) with high performance computing technologies.

We

describe this and give early results based on clustering running with different paradigms.

We

identify key layers where HPC Apache integration is particularly important: File systems,  Cluster resource management, File and object data management,  Inter process and thread communication, Analytics libraries, Workflow and Monitoring.Slide3

NIST Big Data Use CasesSlide4

NIST Requirements and Use Case Subgroup

Part of NIST Big Data Public Working Group (NBD-PWG) June-September 2013 http://bigdatawg.nist.gov/Leaders of activity

Wo

Chang,

NIST

Robert Marcus,

ET-Strategies

Chaitanya Baru, UC San DiegoThe focus is to form a community of interest from industry, academia, and government, with the goal of developing a consensus list of Big Data requirements across all stakeholders. This includes gathering and understanding various use cases from diversified application domains.TasksGather use case input from all stakeholders Derive Big Data requirements from each use case. Analyze/prioritize a list of challenging general requirements that may delay or prevent adoption of Big Data deployment Develop a set of general patterns capturing the “essence” of use cases (to do)Work with Reference Architecture to validate requirements and reference architecture by explicitly implementing some patterns based on use cases

4Slide5

Big Data Definition

More consensus on Data Science definition than that of Big DataBig Data refers to digital data volume,

velocity

and/or

variety

that

:

Enable novel

approaches to frontier questions previously inaccessible or impractical using current or conventional methods; and/orExceed the storage capacity or analysis capability of current or conventional methods and systems; andDifferentiates by storing and analyzing population data and not sample sizes.Needs management requiring scalability across coupled horizontal resourcesEverybody says their data is big (!) Perhaps how it is used is most important5Slide6

What is Data Science?

I was impressed by number of NIST working group members who were self declared data scientistsI was also impressed by universal adoption by participants of Apache technologies – see laterMcKinsey says there are lots of jobs (1.65M by 2018 in USA) but that’s not enough! Is this a field – what is it and what is its core?

The emergence of the 4

th

or data driven paradigm of science illustrates significance -

http://research.microsoft.com/en-us/collaboration/fourthparadigm/

Discovery is guided by data rather than by a model

The End of (traditional) science http://www.wired.com/wired/issue/16-07 is famous hereAnother example is recommender systems in Netflix, e-commerce etc. where pure data (user ratings of movies or products) allows an empirical prediction of what users likeSlide7

http://

www.wired.com/wired/issue/16-07

September 2008Slide8

Data Science Definition

Data Science is the extraction of actionable knowledge directly from data through a process of discovery, hypothesis, and analytical hypothesis analysis.

8

A

Data Scientist

is a practitioner who has sufficient knowledge of the overlapping regimes of expertise in business needs, domain knowledge, analytical skills and programming expertise to manage the end-to-end scientific method process through each stage in the big data lifecycle.Slide9

Use Case Template

26 fields completed for 51 areasGovernment Operation

: 4

Commercial:

8

Defense: 3

Healthcare and Life Sciences:

10

Deep Learning and Social Media: 6The Ecosystem for Research: 4Astronomy and Physics: 5Earth, Environmental and Polar Science: 10Energy: 19Slide10

51 Detailed Use Cases:

Contributed July-September 2013Covers goals, data features such as 3 V’s, software, hardwarehttp://bigdatawg.nist.gov/usecases.php

https://

bigdatacoursespring2014.appspot.com/course

(Section 5)

Government Operation(4):

National Archives and Records

Administration, Census Bureau

Commercial(8): Finance in Cloud, Cloud Backup, Mendeley (Citations), Netflix, Web Search, Digital Materials, Cargo shipping (as in UPS)Defense(3): Sensors, Image surveillance, Situation AssessmentHealthcare and Life Sciences(10): Medical records, Graph and Probabilistic analysis, Pathology, Bioimaging, Genomics, Epidemiology, People Activity models, BiodiversityDeep Learning and Social Media(6): Driving Car, Geolocate images/cameras, Twitter, Crowd Sourcing, Network Science, NIST benchmark datasetsThe Ecosystem for Research(4): Metadata, Collaboration, Language Translation, Light source experimentsAstronomy and Physics(5):

Sky Surveys including comparison to simulation, Large Hadron Collider at CERN, Belle Accelerator II in Japan

Earth

, Environmental and Polar

Science(10):

Radar Scattering in Atmosphere, Earthquake, Ocean, Earth Observation, Ice sheet Radar scattering, Earth radar mapping, Climate simulation datasets, Atmospheric

turbulence identification, Subsurface

Biogeochemistry (microbes

to watersheds), AmeriFlux and FLUXNET

gas sensors

Energy(1):

Smart grid

10

26 Features for each use case

Biased to scienceSlide11

Part of Property Summary Table

11Slide12

3: Census Bureau Statistical Survey Response Improvement (Adaptive Design)

Application: Survey costs are increasing as survey response declines. The goal of this work is to use advanced “recommendation system techniques” that are open and scientifically objective, using data mashed up from several sources and historical survey para-data (administrative data about the survey) to drive operational processes in an effort to increase quality and reduce the cost of field surveys.

Current

Approach:

About a petabyte of data coming from surveys and other government administrative sources. Data can be streamed with approximately 150 million records transmitted as field data streamed continuously, during the decennial census. All data must be both confidential and secure. All processes must be auditable for security and confidentiality as required by various legal statutes. Data quality should be high and statistically checked for accuracy and reliability throughout the collection process. Use Hadoop, Spark, Hive, R, SAS, Mahout,

Allegrograph

, MySQL, Oracle, Storm,

BigMemory

, Cassandra, Pig software.Futures: Analytics needs to be developed which give statistical estimations that provide more detail, on a more near real time basis for less cost. The reliability of estimated statistics from such “mashed up” sources still must be evaluated.12

GovernmentSlide13

7: Netflix Movie Service

Application: Allow streaming of user selected movies to satisfy multiple objectives (for different stakeholders) -- especially retaining subscribers. Find best possible ordering of a set of videos for a user (household) within a given context in real-time; maximize movie consumption. Digital movies stored in cloud with metadata; user profiles and rankings for small fraction of movies for each user. Use multiple criteria – content based recommender system; user-based recommender system; diversity. Refine algorithms continuously with A/B testing.

Current

Approach:

Recommender systems and streaming video delivery are core Netflix technologies. Recommender systems are always personalized and use logistic/linear regression, elastic nets, matrix factorization, clustering, latent Dirichlet allocation, association rules, gradient boosted decision trees

etc.

Winner of Netflix competition (to improve ratings by 10%) combined over 100 different algorithms. Uses SQL,

NoSQL

, MapReduce on Amazon Web Services. Netflix recommender systems have features in common to e-commerce like Amazon. Streaming video has features in common with other content providing services like iTunes, Google Play, Pandora and Last.fm.Futures: Very competitive business. Need to be aware of other companies and trends in both content (which Movies are hot) and technology. Need to investigate new business initiatives such as Netflix sponsored content13

CommercialSlide14

15: Intelligence Data Processing and Analysis

Application: Allow Intelligence Analysts to a) Identify relationships between entities (people, organizations, places, equipment) b) Spot trends in sentiment or intent for either general population or leadership group (state, non-state actors) c) Find location of and possibly timing of hostile actions (including implantation of IEDs) d) Track the location and actions of (potentially) hostile actors e) Ability to reason against and derive knowledge from diverse, disconnected, and frequently unstructured (e.g. text) data sources f) Ability to process data close to the point of collection and allow data to be shared easily to/from individual soldiers, forward deployed units, and senior leadership in garrison

.

Current

Approach:

Software includes Hadoop,

Accumulo

(Big Table),

Solr, Natural Language Processing, Puppet (for deployment and security) and Storm running on medium size clusters. Data size in 10s of Terabytes to 100s of Petabytes with Imagery intelligence device gathering petabyte in a few hours. Dismounted warfighters would have at most 1-100s of Gigabytes (typically handheld data storage).Futures: Data currently exists in disparate silos which must be accessible through a semantically integrated data space. Wide variety of data types, sources, structures, and quality which will span domains and requires integrated search and reasoning. Most critical data is either unstructured or imagery/video which requires significant processing to extract entities and information. Network quality, Provenance and security essential.14

DefenseSlide15

26: Large-scale Deep Learning

Application: Large models (e.g., neural networks with more neurons and connections) combined with large datasets are increasingly the top performers in benchmark tasks for vision, speech, and Natural Language Processing. One needs to train a deep neural network from a large (>>1TB) corpus of data (typically imagery, video, audio, or text). Such training procedures often require customization of the neural network architecture, learning criteria, and dataset pre-processing. In addition to the computational expense demanded by the learning algorithms, the need for rapid prototyping and ease of development is extremely high

.

Current

Approach:

The

largest applications so far are to image recognition and scientific studies of unsupervised learning with 10 million images and up to 11 billion parameters on a 64 GPU HPC Infiniband cluster. Both supervised (using existing classified images) and unsupervised

applications15Deep LearningSocial Networking

Futures:

Large datasets of 100TB or more may be necessary in order to exploit the representational power of the larger models. Training a self-driving car could take 100 million images at megapixel resolution. Deep Learning shares many characteristics with the broader field of machine learning. The paramount requirements are high computational throughput for mostly dense linear algebra operations, and extremely high productivity for researcher exploration. One needs integration of high performance libraries with high level (python) prototyping environments

IN

Classified OUTSlide16

35: Light source beamlines

Application: Samples are exposed to X-rays from light sources in a variety of configurations depending on the experiment. Detectors (essentially high-speed digital cameras) collect the data. The data are then analyzed to reconstruct a view of the sample or process being studied. Current

Approach:

A variety of commercial and open source software is used for data analysis – examples including Octopus for Tomographic Reconstruction,

Avizo

(http://vsg3d.com) and FIJI (a distribution of

ImageJ

) for Visualization and Analysis. Data transfer is accomplished using physical transport of portable media (severely limits performance) or using high-performance GridFTP, managed by Globus Online or workflow systems such as SPADE.

Futures: Camera resolution is continually increasing. Data transfer to large-scale computing facilities is becoming necessary because of the computational power required to conduct the analysis on time scales useful to the experiment. Large number of beamlines (e.g. 39 at LBNL ALS) means that total data load is likely to increase significantly and require a generalized infrastructure for analyzing gigabytes per second of data from many beamline detectors at multiple facilities. 16

Research EcosystemSlide17

36: Catalina Real-Time Transient Survey (CRTS): a digital, panoramic, synoptic sky survey I

Application: The survey explores the variable universe in the visible light regime, on time scales ranging from minutes to years, by searching for variable and transient sources. It discovers a broad variety of astrophysical objects and phenomena, including various types of cosmic explosions (e.g., Supernovae), variable stars, phenomena associated with accretion to massive black holes (active galactic nuclei) and their relativistic jets, high proper motion stars, etc. The data are collected from 3 telescopes (2 in Arizona and 1 in Australia), with additional ones expected in the near future (in Chile).

Current

Approach:

The survey generates up to ~ 0.1 TB on a clear night with a total of ~100 TB in current data holdings. The data are preprocessed at the telescope, and transferred to Univ. of Arizona and Caltech, for further analysis, distribution, and archiving. The data are processed in real time, and detected transient events are published electronically through a variety of dissemination mechanisms, with no proprietary withholding period (CRTS has a completely open data policy). Further data analysis includes classification of the detected transient events, additional observations using other telescopes, scientific interpretation, and publishing. In this process, it makes a heavy use of the archival data (several PB’s) from a wide variety of geographically distributed resources connected through the Virtual Observatory (VO) framework

.

17

Astronomy & PhysicsSlide18

36: Catalina Real-Time Transient Survey (CRTS): a digital, panoramic, synoptic sky survey II

Futures: CRTS is a scientific and methodological testbed and precursor of larger surveys to come, notably the Large Synoptic Survey Telescope (LSST), expected to operate in 2020’s and selected as the highest-priority ground-based instrument in the 2010 Astronomy and Astrophysics Decadal Survey. LSST will gather about 30 TB per night.

18

Astronomy & PhysicsSlide19

47: Atmospheric Turbulence - Event Discovery and Predictive Analytics

Application: This builds datamining on top of reanalysis products including the North American Regional Reanalysis (NARR) and the Modern-Era Retrospective-Analysis for Research (MERRA) from NASA where latter described earlier. The analytics correlate aircraft reports of turbulence (either from pilot reports or from automated aircraft measurements of eddy dissipation rates) with recently completed atmospheric re-analyses. This is of value to aviation industry and to weather forecasters. There are no standards for re-analysis products complicating system where MapReduce is being investigated. The reanalysis data is hundreds of terabytes and slowly updated whereas turbulence is smaller in size and implemented as a streaming service.

19

Earth, Environmental

and

Polar Science

Current Approach:

Current 200TB dataset can be analyzed with MapReduce or the like using

SciDB

or other scientific database.

Futures:

The dataset will reach 500TB in 5 years. The initial turbulence case can be extended to other ocean/atmosphere phenomena but the analytics would be different in each case.

Typical NASA image of turbulent wavesSlide20

51: Consumption forecasting in Smart Grids

Application: Predict energy consumption for customers, transformers, sub-stations and the electrical grid service area using smart meters providing measurements every 15-mins at the granularity of individual consumers within the service area of smart power utilities. Combine Head-end of smart meters (distributed), Utility databases (Customer Information, Network topology; centralized), US Census data (distributed), NOAA weather data (distributed), Micro-grid building information system (centralized), Micro-grid sensor network (distributed). This generalizes to real-time data-driven analytics for time series from cyber physical systems

Current

Approach:

GIS based visualization. Data is around 4 TB a year for a city with 1.4M sensors in Los Angeles. Uses R/Matlab,

Weka

, Hadoop software. Significant privacy issues requiring anonymization by aggregation. Combine real time and historic data with machine learning for predicting consumption

.

Futures: Wide spread deployment of Smart Grids with new analytics integrating diverse data and supporting curtailment requests. Mobile applications for client interactions.20EnergySlide21

10 Suggested Generic Use Cases

Multiple users performing interactive queries and updates on a database with basic availability and eventual consistency (BASE)Perform real time analytics on data source streams and notify users when specified events occur

Move

data from external data sources into a highly horizontally scalable data store, transform it using highly horizontally scalable processing (e.g. Map-Reduce), and return it to the horizontally scalable data store (ELT)

Perform

batch analytics on the data in a highly horizontally scalable data store using highly horizontally scalable processing (

e.g

MapReduce) with a user-friendly interface (e.g. SQL like)Perform interactive analytics on data in analytics-optimized databaseVisualize data extracted from horizontally scalable Big Data scoreMove data from a highly horizontally scalable data store into a traditional Enterprise Data WarehouseExtract, process, and move data from data stores to archivesCombine data from Cloud databases and on premise data stores for analytics, data mining, and/or machine learningOrchestrate multiple sequential and parallel data transformations and/or analytic processing using a workflow managerSlide22

10 Security & Privacy Use Cases

Consumer Digital Media UsageNielsen HomescanWeb Traffic AnalyticsHealth Information

Exchange

Personal

Genetic Privacy

Pharma

Clinic Trial Data Sharing

Cyber-securityAviation IndustryMilitary - Unmanned Vehicle sensor dataEducation - “Common Core” Student Performance ReportingNeed to integrate 10 “generic” and 10 “security & privacy” with 51 “full use cases” Slide23

Management

Security & Privacy

Big Data Application Provider

Visualization

Access

Analytics

Curation

Collection

System Orchestrator

DATA

SW

DATA

SW

INFORMATION VALUE CHAIN

IT VALUE CHAIN

Data Consumer

Data Provider

Horizontally

Scalable (VM clusters)

Vertically Scalable

Horizontally Scalable

Vertically Scalable

Horizontally Scalable

Vertically Scalable

Big Data Framework Provider

Processing Frameworks (analytic

tools, etc.)

Platforms (databases,

etc.)

Infrastructures

Physical and Virtual Resources (networking, computing, etc.)

DATA

SW

K E Y :

SW

Service Use

Data Flow

Analytics Tools Transfer

23

DATA

NIST Big Data Reference ArchitectureSlide24

Requirements Extraction Process

Two-step process is used for requirement extraction:Extract specific requirements and map to reference architecture based on each application’s characteristics such

as:

data

sources

(data size, file formats, rate of grow, at rest or in motion, etc

.)

data

lifecycle management (curation, conversion, quality check, pre-analytic processing, etc.)data transformation (data fusion/mashup, analytics),capability infrastructure (software tools, platform tools, hardware resources such as storage and networking), and

data

usage

(processed results in text, table, visual, and other formats

).

all

architecture

components informed by Goals and use case

description

Security & Privacy

has direct map

Aggregate

all specific requirements into high-level generalized requirements which are vendor-neutral and technology agnostic.

24Slide25

Size of Process

The draft use case and requirements report is 264 pagesHow much web and how much publication?35 General Requirements437 Specific Requirements 8.6 per use case, 12.5 per general requirement

Data Sources:

3 General 78 Specific

Transformation:

4 General 60 Specific

Capability (Infrastructure):

6 General 133 Specific

Data Consumer: 6 General 55 SpecificSecurity & Privacy: 2 General 45 SpecificLifecycle: 9 General 43 SpecificOther: 5 General 23 SpecificNot clearly useful – prefer to identify common “structure/kernels”25Slide26

Significant Web Resources

Index to all use cases http://bigdatawg.nist.gov/usecases.phpThis links to individual submissions and other processed/collected information

List of specific requirements versus use case

http://bigdatawg.nist.gov/uc_reqs_summary.php

List of general requirements versus architecture component

http://bigdatawg.nist.gov/uc_reqs_gen.php

List of general requirements versus architecture component with record of use cases giving requirement http://bigdatawg.nist.gov/uc_reqs_gen_ref.php List of architecture component and specific requirements plus use case constraining this component http://bigdatawg.nist.gov/uc_reqs_gen_detail.php 26Slide27

Would like to capture “essence of these use cases”

“small” kernels, mini-appsOr Classify applications into patternsDo it from HPC background not database view pointe.g. focus on cases with detailed analytics

Section 5 of my class

https://bigdatacoursespring2014.appspot.com/preview

classifies 51 use cases with

ogre facetsSlide28

What are “mini-Applications”

Use for benchmarks of computers and software (is my parallel compiler any good?)In parallel computing, this is well establishedLinpack for measuring performance to rank machines in Top500 (changing?)NAS Parallel Benchmarks

(originally a pencil and paper specification to allow optimal implementations; then MPI library)

Other

specialized Benchmark sets

keep changing and used to guide procurements

Last 2 NSF hardware solicitations had NO preset benchmarks – perhaps as no agreement on key applications for clouds and data intensive applications

Berkeley dwarfs

capture different structures that any approach to parallel computing must addressTemplates used to capture parallel computing patternsI’ll let experts comment on database benchmarks like TPCSlide29

HPC Benchmark Classics

Linpack or HPL: Parallel LU factorization for solution of linear equationsNPB version 1: Mainly classic HPC solver kernelsMG: Multigrid

CG: Conjugate Gradient

FT: Fast Fourier Transform

IS: Integer sort

EP: Embarrassingly Parallel

BT: Block

Tridiagonal

SP: Scalar Pentadiagonal LU: Lower-Upper symmetric Gauss SeidelSlide30

7 Original Berkeley Dwarfs (Colella

)Structured Grids (including locally structured grids, e.g. Adaptive Mesh Refinement)

Unstructured

Grids

Fast

Fourier Transform

Dense

Linear Algebra

Sparse Linear Algebra ParticlesMonte CarloNote “vaguer” than NPBSlide31

13 Berkeley Dwarfs

Dense Linear Algebra Sparse Linear Algebra

Spectral Methods

N-Body Methods

Structured Grids

Unstructured Grids

MapReduce

Combinational Logic

Graph TraversalDynamic ProgrammingBacktrack and Branch-and-BoundGraphical ModelsFinite State MachinesFirst 6 of these correspond to Colella’s original. Monte Carlo droppedN-body methods are a subset of ParticleNote a little inconsistent in that MapReduce is a programming model and spectral method is a numerical method Need multiple facets!Slide32

Distributed Computing MetaPatterns

IJha, Cole, Katz, Parashar, Rana, WeissmanSlide33

Distributed Computing MetaPatterns

IIJha, Cole, Katz, Parashar, Rana, WeissmanSlide34

Distributed Computing MetaPatterns

IIIJha, Cole, Katz, Parashar, Rana, WeissmanSlide35

Core Analytics

Facet of Ogres (microPattern)

Search/Query

Local Machine Learning

– pleasingly parallel

Summarizing

statistics

Recommender

Systems (Collaborative Filtering) Outlier Detection (iORCA) Clustering (many methods), LDA (Latent Dirichlet Allocation) or variants like PLSI (Probabilistic Latent Semantic Indexing),

SVM

and Linear Classifiers (Bayes, Random Forests),

PageRank

,

(Find leading eigenvector of sparse matrix)

SVD

(Singular Value Decomposition),

Learning Neural Networks (

Deep Learning

),

MDS

(Multidimensional Scaling),

Graph Structure Algorithms

(seen in

search

of RDF Triple stores),

Network Dynamics - Graph

simulation Algorithms

(epidemiology)

Matrix

Algebra

Global

OptimizationSlide36

Problem Architecture Facet of Ogres (Meta or

MacroPattern)Pleasingly Parallel – as in Blast, Protein docking, some

(bio-)imagery

Local Analytics or Machine

Learning

– ML or filtering pleasingly parallel as in bio-imagery, radar

images (really just pleasingly parallel but sophisticated local analytics)

Global Analytics or Machine

Learning seen in LDA, Clustering etc. with parallel ML over nodes of system SPMD (Single Program Multiple Data)Bulk Synchronous Processing: well defined compute-communication phasesFusion: Knowledge discovery often involves fusion of multiple methods. Workflow (often used in fusion)Slide37

18: Computational Bioimaging

Application: Data delivered from bioimaging is increasingly automated, higher resolution, and multi-modal. This has created a data analysis bottleneck that, if resolved, can advance the biosciences discovery through Big Data techniques.

Current

Approach:

The current piecemeal analysis approach does not scale to situation where a single scan on emerging machines is 32TB and medical diagnostic imaging is annually around 70 PB

even excluding

cardiology. One needs a web-based one-stop-shop for high performance, high throughput image processing for producers and consumers of models built on bio-imaging data.

Futures:

Goal is to solve that bottleneck with extreme scale computing with community-focused science gateways to support the application of massive data analysis toward massive imaging data sets. Workflow components include data acquisition, storage, enhancement, minimizing noise, segmentation of regions of interest, crowd-based selection and extraction of features, and object classification, and organization, and search. Use ImageJ, OMERO, VolRover, advanced segmentation and feature detection software. 37

Healthcare

Life Sciences

Largely Local Machine LearningSlide38

27: Organizing large-scale, unstructured collections of consumer photos I

Application: Produce 3D reconstructions of scenes using collections of millions to billions of consumer images, where neither the scene structure nor the camera positions are known a priori. Use resulting 3d models to allow efficient browsing of large-scale photo collections by geographic position.

Geolocate

new images by matching to 3d models. Perform object recognition on each image. 3d reconstruction

posed

as a robust non-linear least squares optimization problem

where observed relations

between images are constraints and unknowns are 6-d camera pose of each image and 3-d position of each point in the scene.

Current Approach: Hadoop cluster with 480 cores processing data of initial applications. Note over 500 billion images on Facebook and over 5 billion on Flickr with over 500 million images added to social media sites each day.38Deep Learning

Social Networking

Global Machine Learning after Initial Local stepsSlide39

27: Organizing large-scale, unstructured collections of consumer photos II

Futures: Need many analytics including feature extraction, feature matching, and large-scale probabilistic inference, which appear in many or most computer vision and image processing problems, including recognition, stereo resolution, and image denoising. Need to visualize large-scale 3-d reconstructions, and navigate large-scale collections of images that have been aligned to maps.

39

Deep Learning

Social Networking

Global Machine Learning after Initial Local stepsSlide40

This Facet of Ogres has

FeaturesThese core analytics/kernels can be classified by features like (a) Flops per byte;

(b) Communication

Interconnect

requirements;

(c) Is application (graph)

constant

or

dynamic(d) Most applications consist of a set of interconnected entities; is this regular as a set of pixels or is it a complicated irregular graph(d) Is communication BSP or Asynchronous; in latter case shared memory may be attractive(e) Are algorithms Iterative or not?(f) Are data points in metric or non-metric spaces Slide41

Application Class Facet of Ogres

(a) Search and query(b) Maximum Likelihood,

(c)

2

minimizations

,

(d) Expectation Maximization (often Steepest descent) (e) Global Optimization (Variational Bayes)(f) Agents, as in epidemiology (swarm approaches) (g) GIS (Geographical Information Systems).Not as essentialSlide42

Data Source Facet of Ogres

(i) SQL, (ii)

NOSQL

based,

(

iii)

Other Enterprise data systems (10 examples from Bob Marcus)

(iv)

Set of Files (as managed in iRODS), (v) Internet of Things, (vi) Streaming and (vii) HPC simulations. Before data gets to compute system, there is often an initial data gathering phase which is characterized by a block size and timing. Block size varies from month (Remote Sensing, Seismic) to day (genomic) to seconds or lower (Real time control, streaming)There are storage/compute system styles: Shared, Dedicated, Permanent, Transient

Other characteristics are need for permanent

auxiliary/comparison datasets

a

nd these could be interdisciplinary implying nontrivial data movement/replicationSlide43

Lessons / Insights

Ogres classify Big Data applications by multiple facets – each with several exemplars and featuresGuide to breadth and depth of Big DataDoes your architecture/software support all the ogres?Add database exemplars

In parallel computing, the simple analytic kernels dominate mindshare even though agreed limitedSlide44

HPC-ABDS

Integrating High Performance Computing with Apache Big Data StackSlide45

EnhancedApache Big Data Stack

ABDS

~120 Capabilities

>40 Apache

Green

layers have strong HPC Integration

opportunities

Goal

Functionality of ABDSPerformance of HPCSlide46

Broad Layers in HPC-ABDS

Workflow-OrchestrationApplication and AnalyticsHigh level ProgrammingBasic Programming model and runtime

SPMD, Streaming, MapReduce, MPI

Inter process communication

Collectives, point to point, publish-subscribe

In memory databases/caches

Object-relational mapping

SQL and

NoSQL, File managementData TransportCluster Resource Management (Yarn, Slurm, SGE)File systems(HDFS, Lustre …)DevOps (Puppet, Chef …)IaaS Management from HPC to hypervisors (OpenStack)Cross CuttingMessage Protocols

Distributed Coordination

Security & Privacy

MonitoringSlide47
Slide48
Slide49

Getting High Performance on Data Analytics (e.g. Mahout, R …)

On the systems side, we have two principlesThe Apache Big Data Stack with ~120 projects has important broad functionality with a vital large support organization

HPC

including MPI has striking success in delivering high performance with

however

a fragile sustainability

model

There are

key systems abstractions which are levels in HPC-ABDS software stack where Apache approach needs careful integration with HPCResource managementStorageProgramming model -- horizontal scaling parallelismCollective and Point to Point communicationSupport of iterationData interface (not just key-value)In application areas, we define application abstractions to supportGraphs/network 

Geospatial

Images etc.Slide50

Mahout and Hadoop MR

– Slow due to MapReducePython slow as Scripting

Spark

Iterative MapReduce, non optimal communication

Harp

Hadoop plug in

with ~MPI collectives

MPI

fastest as C not JavaIncreasingCommunication

Identical ComputationSlide51

4 Forms of MapReduce

51


(a) Map Only

(d) Loosely Synchronous

(c) Iterative MapReduce

(b) Classic MapReduce


Input


map


reduce


Input


map


reduce

Iterations

Input


Output


map


P

ij

BLAST Analysis

Parametric sweep

Pleasingly Parallel

High Energy Physics (HEP) Histograms

Distributed search


Classic MPI

PDE Solvers and

particle dynamics


Domain of MapReduce and Iterative

Extensions

Science Clouds

MPI

Giraph

Expectation maximization

Clustering

e.g.

Kmeans

Linear

Algebra

,

Page

Rank


MPI is Map followed by Point to Point or Collective Communication

– as in style c) plus d)Slide52

Map Collective Model (Judy Qiu)

Generalizes Iterative MapReduceCombine MPI and MapReduce ideasImplement collectives optimally on Infiniband, Azure, Amazon ……

52

Input

map

Generalized

Reduce

Initial

Collective

Step

Final

Collective

Step

IterateSlide53

Major Analytics Architectures in Use Cases

Pleasingly Parallel including local machine learning as in parallel over images and apply image processing to each image -- HadoopSearch including collaborative filtering and motif finding implemented using classic MapReduce (Hadoop) or non iterative

Giraph

Iterative MapReduce

using Collective Communication (clustering) – Hadoop with Harp, Spark …..

Iterative

Giraph

(MapReduce) with point to point communication (most graph algorithms such as maximum clique, connected component, finding diameter, community detection)Vary in difficulty of finding partitioning (classic parallel load balancing)Shared memory thread based (event driven) graph algorithms (shortest path, Betweenness centrality)Slide54

HPC-ABDSHourglass

HPC ABDS

System (Middleware)

High performance

Applications

HPC Yarn for Resource management

Horizontally scalable parallel programming model

Collective

and Point to Point communication

Support of

iteration

System Abstractions/standards

Data format

Storage

120 Software Projects

Application Abstractions/standards

Graphs, Networks, Images, Geospatial ….

SPIDAL (Scalable Parallel Interoperable Data Analytics Library)

or High performance Mahout, R,

Matlab

…..Slide55

Integrating Yarn with HPCSlide56

Using Optimal “Collective” Operations

Twister4Azure Iterative MapReduce with enhanced collectivesMap-AllReduce primitive and MapReduce-MergeBroadcast.Strong Scaling on

Kmeans

for up to 256 cores on AzureSlide57

Collectives improve traditional MapReduce

This is Kmeans running within basic Hadoop but with optimal AllReduce collective operationsRunning on Infiniband Linux ClusterSlide58

Shaded areas are computing only where Hadoop on HPC cluster fastestA

reas above shading are overheads where T4A smallest and T4A with AllReduce collective has lowest overheadNote even on Azure Java (Orange) faster than T4A C# for compute

58

Kmeans and (Iterative) MapReduceSlide59

Harp Architecture

YARN

MapReduce

V2

Harp

MapReduce

Applications

Map-Collective Applications

Application

Framework

Resource ManagerSlide60

Features of Harp Hadoop Plug in

Hadoop Plugin (on Hadoop 1.2.1 and Hadoop 2.2.0)Hierarchical data abstraction on arrays, key-values and graphs for easy programming expressiveness.Collective communication model to support various communication operations on the data abstractions.Caching with buffer management for memory allocation required from computation and communication

BSP style parallelism

Fault tolerance with check-pointingSlide61

Performance on Madrid Cluster (8 nodes)

Note compute same in each case as product of centers times points identical

Increasing

Communication

Identical ComputationSlide62

Mahout and Hadoop MR

– Slow due to MapReducePython slow as Scripting

Spark

Iterative MapReduce, non optimal communication

Harp

Hadoop plug in

with ~MPI collectives

MPI

fastest as C not JavaIncreasingCommunication

Identical ComputationSlide63

Performance of MPI Kernel Operations

Pure Java as in FastMPJ slower than Java interfacing to C version of MPISlide64

Lessons / Insights

Integrate (don’t compete) HPC with “Commodity Big data” (Google to Amazon to Enterprise data Analytics) i.e. improve Mahout; don’t compete with it

Use

Hadoop plug-ins

rather than replacing Hadoop

Enhanced Apache Big Data Stack

HPC-ABDS has 120 members

– please improve list!

HPC-ABDS+ Integration areas include file systems, cluster resource management, file and object data management, inter process and thread communication,

analytics libraries

,

Workflow

monitoring