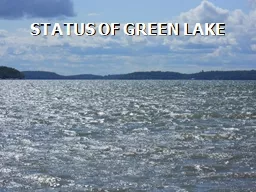
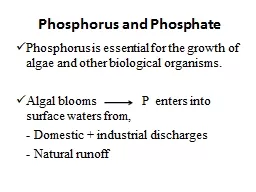
Lucy Crockford Walsh Fellow Trinity College Dublin Whats impeding this lakes recovery Outline Policy Pollution sources and eutrophication Work on the lake Results so far Interpretation ID: 478169
Download Presentation The PPT/PDF document "Phosphorus eutrophication in an inter-dr..." is the property of its rightful owner. Permission is granted to download and print the materials on this web site for personal, non-commercial use only, and to display it on your personal computer provided you do not modify the materials and that you retain all copyright notices contained in the materials. By downloading content from our website, you accept the terms of this agreement.
Slide1
Phosphorus eutrophication in an inter-drumlin lake: causes and effects
Lucy CrockfordWalsh FellowTrinity College Dublin
What’s impeding this lake’s recovery?Slide2
Outline
Policy
Pollution sources and eutrophication
Work on the lakeResults so far
InterpretationSlide3
Policy
OECD and Tierney, 2008
SI 272 2009Slide4
Pollution Sources in Rural Catchments
Diffuse
Point
UnknownSlide5
Project Objective:
To determine the main processes that are contributing to the increased P concentrationsExternal P loads
Internal P loadsWind induced resuspension in shallow areasResearch Questions
What are the main contributors of P?Which contributors are the primary factor in the impediment of lake recovery despite source recovery?
How are the dynamics of the lake contributing to the P concentrations – biological, chemical, morphological, catchment use etc.?
How can high frequency monitoring improve our understanding of lake dynamics particularly the impact of episodic events, DO fluctuations, and the signal of the
Chl
a sensor?
Internal Lake Sources
Source: SØNdergaard et al., 2001Slide6
Work on the Lake
Buoys
Data Sondes – Chlorophyll a, conductivity, dissolved oxygen, temperature, redox, pH - hourly
Manual sampling – P fractions, phytoplankton, zooplankton
Bi-monthlySlide7
Cross Section of the LakeSlide8
Neighbouring CatchmentSlide9
Results so Far
Weather and external loadingSlide10Slide11
Manual Sampling P fractions, Nitrate and Chl aSlide12
Surface Sondes Chl a
Deep Sonde DOSlide13
Summary Statistics Water Year Oct 2010 to Sept 2011Slide14
ConclusionsLake is switching between meso and eutrophic status.
The external load of P is low - inline with source reduction?Internal loading is occurring in anoxic water.The lake suddenly mixing fertilises photic zone – May 2011Wind factor seems to not be increasing P concentrations at eastern end.Slide15
Future Work
Chl a crash in spring not determined yet...Lack of Chl a response to high nutrients at end of summer during fine weather also not determinedQuantify P loads and signal from sondes wrt chlorophyll a
Draw conclusions on the factors impeding lake recovery.Slide16
Algal Bloom
July 2011Slide17
References
SØNdergaard M, Jensen JP, Jeppesen E. Retention and internal loading of phosphorus in shallow, eutrophic lakes. TheScientificWorld 2001; 1: 427-442.Tierney D. Water Quality of Lakes. State of the Environment in Ireland. Environmental Protection Agency, Johnstown Castle, Wexford, 2008.
Acknowledgements
The Agricultural Catchments Programme, Teagasc
Profs Philip Jordan and David Taylor
Drs Alice
Melland
and Per-Erik
Mellander
Mr John Kennedy
GLEON technical groupSlide18
Questions?Slide19
Hypotheses – Spring Chl a crash
Grazing pressure.Lake overturning and “diluting” the Chlorophyll a concentration.Reduction in available nutrients so population could not be sustained.Slide20
Hypotheses – Increased Deep Water SRP concentrations
Release from sediments aka internal loading.External inputs from the catchment.Wind induced resuspension of sediments.Slide21
Hypotheses – Increased Surface SRP concentrations at end of Summer
Lake overturning due to poor weather.External loading from the catchment.Wind induced resuspension.Slide22
1 m Data Sonde
9 m Data Sonde
1 m Data Sonde
Lake Sediment
WEST
EAST
Abstraction
(245684 m
3
yr
-1
)
Lake Volume
1223389 m
3
Thermocline (6-7m)
Statistical Significance Testing
N = 11
Independent T test
P = 0.9243
Difference in annual means is not statistically significantSlide23
1 m Data Sonde
9 m Data Sonde
1 m Data Sonde
Lake Sediment
WEST
EAST
Abstraction
(245684 m
3
yr
-1
)
Lake Volume
1223389 m
3
Thermocline (6-7m)
N = 11
Independent T test
P = 0.9609
Difference in annual means is not statistically significant
Statistical Significance TestingSlide24
1 m Data Sonde
9 m Data Sonde
1 m Data Sonde
Lake Sediment
WEST
EAST
Abstraction
(245684 m
3
yr
-1
)
Lake Volume
1223389 m
3
Thermocline (6-7m)
N = 11
Independent T test
P = 0.9362
Difference in annual means is not statistically significant
Statistical Significance TestingSlide25
1 m Data Sonde
9 m Data Sonde
1 m Data Sonde
Lake Sediment
WEST
EAST
Abstraction
(245684 m
3
yr
-1
)
Lake Volume
1223389 m
3
Thermocline (6-7m)
N = 11
Independent T test
P =
0.1752
Difference in annual means is not statistically significant – but p value much lower than other sample combinations
Statistical Significance TestingSlide26
High Frequency Turbidity