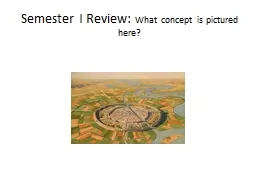
What concept is pictured here What concept is being shown here What is also pictured here What Stage of the Demographic Transition Model What kind of maps What model is this What other ideas are shown here ID: 494682
Download Presentation The PPT/PDF document "Semester I Review:" is the property of its rightful owner. Permission is granted to download and print the materials on this web site for personal, non-commercial use only, and to display it on your personal computer provided you do not modify the materials and that you retain all copyright notices contained in the materials. By downloading content from our website, you accept the terms of this agreement.
Slide1
Semester I Review: What concept is pictured here?Slide2
What concept is being shown here? What is also pictured here?Slide3
What Stage of the Demographic Transition Model? Slide4
What kind of maps?Slide5
What model is this? What other ideas are shown here?Slide6
What kind of diffusion?Slide7
When did LDC countries enter Stage 2? When did MDC countries enter Stage 2?Slide8
What kind of state?
Alaska, USASlide9
What stage of the Epidemiologic Transition Model would you find Chile? Afghanistan? Japan? Sierra Leone with Ebola?Slide10
What are 3 reasons why the world could enter Stage 5 of the Epidemiologic Transition?Slide11
Interregional versus intraregional: ExplainSlide12
What 3 concepts are shown here?Slide13
What 2 systems are depicted here?Slide14
What kind of diffusion?Slide15
Which is distance decay, friction of distance, space time compression?Slide16
Why did Europeans leave and head to USA? During what stage? What type of migration?Slide17
What does this map tell you about migration? How does it apply to Lee’s Model? Zelinsky’s
Model?
Ravenstein’s
Model?Slide18
Few people live in what 4 regions according to AP? Slide19
What formula is shown below? Explain the formula.Slide20
What is the difference between net-in migration and net-out migration. What country would be net-in? Net-out?Slide21
What population “rate” vocabulary word is depicted below in the map by noting the map key?Slide22
Brazil’s government encourages what kind of migration move for its people?Slide23
What theory is represented here? Explain two geographers who differed regarding the result?Slide24
Explain the Theory depicted below. By whom?Slide25
Looking at the language tree below, what is the family, branch, and group of the Indo-European Language?Slide26
What kind of map projection is each?Slide27
What is being depicted on each map?Slide28
What are the 3 main Universalizing Religions?Slide29
What are 3 Ethnic Religions?Slide30
Where is the hearth of Judaism? Islam? Buddhism? Hinduism? Animism? Christianity?
Shintoism
? Confucianism?Slide31
What is chain migration? Example. What is distance decay?
Core-domain-periphery? How does it apply to this map?Slide32
Arithmetic, Physiological, Agricultural Density
Farmer equipmentSlide33
How do you explain concentration and density on this world map of people per sq mile?Slide34
Which is habit? Which is custom?Slide35
What two concepts are show here?Slide36
Formal, Functional, Vernacular Region?Slide37
Explain how England’s English began? What Family? What Branch? What Group?Slide38
How does popular culture diffuse? Folk culture diffuse?Slide39
How do languages diffuse? What language is represented below? Name 5.Slide40
What is the history here? Religion? Type of State?Slide41
What is the difference between the “S” Curve and the “J” Curve?Slide42
Which ethnicity represents the most immigrants to the USA in 2015? In 1800s? 1700s – 2 kinds? Slide43
2.1 = Why is this important to know?Slide44
What is this called?Slide45
Which is the Stage 3? Which is Stage 4? Which is Stage 2? Which is ZPG?