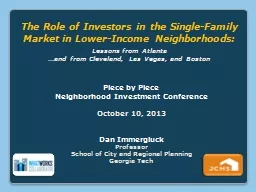
/
  The Role of Investors in the Single-Family Market in Lower-Income Neighborhoods:   The Role of Investors in the Single-Family Market in Lower-Income Neighborhoods:

  The Role of Investors in the Single-Family Market in Lower-Income Neighborhoods: - PowerPoint Presentation

gristlydell
gristlydell . @gristlydell
Follow
346 views
Uploaded On 2020-06-20

  The Role of Investors in the Single-Family Market in Lower-Income Neighborhoods: - PPT Presentation

Lessons from Atlanta and from Cleveland Las Vegas and Boston Piece by Piece Neighborhood Investment Conference October 10 2013 Dan Immergluck Professor School of City and Regional Planning ID: 782517

investors llc 2010 reo llc investors reo 2010 atlanta investor market income neighborhoods rent sales buy property median top

Share:

Link:

Embed:

Download Presentation from below link

Download The PPT/PDF document "  The Role of Investors in the Single-F..." is the property of its rightful owner. Permission is granted to download and print the materials on this web site for personal, non-commercial use only, and to display it on your personal computer provided you do not modify the materials and that you retain all copyright notices contained in the materials. By downloading content from our website, you accept the terms of this agreement.


Presentation Transcript

Slide1


The Role of Investors in the Single-Family Market in Lower-Income Neighborhoods:Lessons from Atlanta…and from Cleveland, Las Vegas, and Boston

Piece by Piece Neighborhood Investment ConferenceOctober 10, 2013Dan ImmergluckProfessorSchool of City and Regional PlanningGeorgia Tech

Slide2

LRIMRI

HRI

VHRILikely REO-Investors Ownership Disproportionately Concentrated in Lower-Income NeighborhoodsCity of Atlanta

No DSF Parcels0 – 0.8%0.8 – 5.9%5.9 – 12%

12% +

Level of Likely REO-Investor Ownership, December 2011

Slide3

LRIMRI

HRIVHRI

median % African-American (2010 Census)

10.6%83.6%

90.1%

94.4%

median poverty rate (2006-2010 ACS)

3.6%

16.7%

36.2%

40.1%

median vacancy rate (2010 Census)7.9%13.7%20.6%33.8%% REO sales to likely investors, 2010-201114.0%27.3%47.3%46.1%% REO sales to investors to small investors, 2010-201187.1%68.0%59.3%67.6%median price of REO sales, 2010-2011$131,850$40,000$18,593$14,750% REO sales to investors 2009-2010, resold w/in 1 yr42.7%32.3%28.5%26.5%% REO sales to investors 2009-2010, w/in 1 yr to investor4.4%8.8%16.2%17.0%

Demographics and

REO-Investor Activity

by

Neighborhood Type

Slide4

Largest Buyers of REO, Fulton County, 2008-09 and 2010-11

20 LARGEST INVESTOR BUYERS OF REO, 2008-09

# OF REO PURCHASES 2008-09

20 LARGEST INVESTOR BUYERS OF REO, 2010-11

# OF REO PURCHASES

2010-11

JOHN GALT ENTERPRISES LLC

99

HARBOUR PORTFOLIO LP

49

BLUE SPRUCE ENTITIES LLC70ATLANTA NEIGHBORHOOD DEV PARTNERSHIP INC44ALAIMO ANTHONY53CPI HOUSING FUND LLC39DOUG COKER PROPERTIES LLP52HABITAT FOR HUMANITY IN ATLANTA INC37RDM HOLDINGS LLC50APD SOLUTIONS FULTON LLC35PAVILACK INDUSTRIES INC49TOP RENTAL RETURNS LLC31WESTLINE MANAGEMENT COMPANY LLC47ALAIMO ANTHONY29B & Z INVESTMENTS LLC44

EQUITY TRUST COMPANY

28

STONECREST INCOME & OPPORTUNITY FUND

44

USA RENTAL FUND LLC

26

CF TWENTY FOUR LLC

37

TRR ATLANTA LLC

23

MID GROUP LLC

36

INTERCONTINENTAL ACQUISITIONS LLC

23

ATLANTA REAL ESTATE INSIDERS LLC

36

ORCHARD TERRACE ESTATES LLC

19

NATIONAL ASSET MANAGEMENT GROUP

34

ASSET MANAGEMENT & INVESTMENTS LLC

16

BIRKHOLZ JOHN

33

CSF ENTERPRISES LLC

16

PROPERTY ACQUISITIONS INVESTMENTS LLC

32

KIDDER PROPERTIES LLC

15

MORRIS ROYCE

32

HYC FINANCIAL LLC

14

HABITAT FOR HUMANITY IN ATLANTA INC

31

STONECREST INCOME & OPPORTUNITY FUND

14

SOUTHERN DEVELOPMENT HOLDINGS GROUP

30

AFFORDABLE HOUSING ASSISTANCE INC

13

GRINMARD GROUP INC

30

ELEVON PROPERTIES LLC

13

SB HOLDINGS LLC

28

REVITALIZE DEVELOPMENT LLC

13

Market share of top 10 (of all likely investors):

9.9%

Market share of top 10 (of all likely investors):

12.2%

Market share of top 20 (of all likely investors):

15.7%

Market share of top 20 (of all likely investors):

17.8%

Slide5

CBD

63

60

76.02

No DSF Units

LRI Tracts

MRI Tracts

HRI Tracts

VHRI Tracts

Tract 60 =

Westview

Tract 63 = PittsburghTract 76.02 = Venetian HillsInterviewing Investors Active on the South/Southwest Side

Slide6

Mallach’s Investor Types -- Modified for Southwest/South Atlanta

Slide7

Learning from conversations with Atlanta investors…Acquisition factors: crime, vacancy, homeownership ratesAll-cash financing typical

In lower-income neighborhoods, investors generally preferred Housing Choice Vouchers (HCVs) -- stability of the rental streamProblems with property managers; some vertically integrate; others try to align incentives and use close oversightInvestors did not complain about excessive code enforcement; lack of enforcement as a major problem

Larger investors appeared to be generally avoiding “distressed” neighborhoods

Slide8

AtlantaClevelandLas VegasBoston

Typical All-In CostsUnder $75k

Under $50k, often lessUnder $150-200kOver $150kInvestor CharacteristicsMostly small; occasional bulk buyingMostly small; some bulk buying

Mostly small, many foreign investorsLocal investors;

s

omewhat

more concentrated

Investor

Strategies

Switched from flipping

to buy-to-rentFlipping; little buy-to-rentBuy-to-rent dominantBuy-to-rent; higher prices may lead to quicker exitsRehab ActivityHCVs important advantage in buy-to-rent, allow for more rehabMore than minimal rehab requires subsidyNewer stock requires less rehabRoutine substantial rehab when property in poor conditionFinancingMostly cashMostly cashMostly cashCash common but also hard money; refinancing via community banks

Slide9

Lessons for Practice and PolicyInvestor behavior fluid – function of market conditionsNSP-type/gut rehab generally not viewed as sustainable for buy-to-rent; standards and cost-structures must be realistic and sustainableHousing and vacant property code and enforcement provide critical context for local investor behavior

In lower-income neighborhoods, substantial rehab for buy-to-rent not always feasible without subsidy (e.g., HCV)

Need for new sources of sustainable financing/subsidy?Need quality control/inspectionsNeed for partnerships/methods to bring institutional investors into distressed neighborhoods in responsible ways