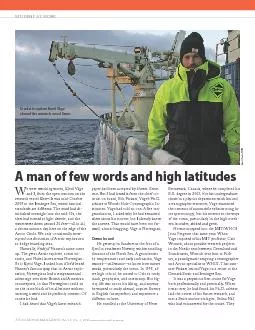
/
<Foliennummer> Kjetil Våge <Foliennummer> Kjetil Våge

<Foliennummer> Kjetil Våge - PowerPoint Presentation

gutsynumero
gutsynumero . @gutsynumero
Follow
342 views
Uploaded On 2020-08-05

<Foliennummer> Kjetil Våge - PPT Presentation

Stefanie Semper Héðinn Valdimarsson Steingrímur Jónsson Kent Moore Bob Pickart Circulation and convection in the Iceland Sea in winter 201516 Iceland Sea August 2015 Semper et al submitted for publication ID: 798915

iceland 2015 volumetric sea 2015 iceland sea volumetric 1981 aagaard swift analysis winter water 1974 upper temperature salinity summer

Share:

Link:

Embed:

Download Presentation from below link

Download The PPT/PDF document "<Foliennummer> Kjetil Våge" is the property of its rightful owner. Permission is granted to download and print the materials on this web site for personal, non-commercial use only, and to display it on your personal computer provided you do not modify the materials and that you retain all copyright notices contained in the materials. By downloading content from our website, you accept the terms of this agreement.


Presentation Transcript

Slide1

<Foliennummer>

Kjetil Våge

Stefanie Semper

Héðinn Valdimarsson

Steingrímur JónssonKent MooreBob Pickart

Circulation and convection in the Iceland Sea in winter 2015-16

Iceland Sea

August 2015

Slide2

Semper et al. (submitted for publication)

Slide3

3 gliders deployed from summer/fall 2015 to spring 2016

Slide4

Double cyclonic gyre in the Iceland Sea

de Jong et al. (2018)

Slide5

Iceland Sea Gyre circulation

Slide6

Slide7

Slide8

Transport: 1.9 Sv

Slide9

Transport: 1.6 Sv

Slide10

Swift and Aagaard (1981)

Volumetric analysis

Mean temperature and salinity above σ

θ

= 28.05 kg/m3 in summer 1974

Slide11

Swift and Aagaard (1981)

Volumetric analysis

Mean temperature and salinity above σ

θ

= 28.05 kg/m3 in winter 1975

Mean temperature and salinity above σθ = 28.05 kg/m3 in summer 1974

Slide12

Volumetric analysis

Swift and Aagaard (1981)

Slide13

Volumetric analysis

Swift and Aagaard (1981)

Slide14

Volumetric analysis

Swift and Aagaard (1981)

Slide15

Volumetric analysis

Increase in upper Arctic Intermediate Water (-1 – 2 ⁰C, 34.7 – 34.9) from 10 or 12% to 22%

Swift and Aagaard (1981)

Slide16

Data from gliders, ships, and Argo floats

Slide17

Slide18

Slide19

Slide20

Slide21

Slide22

Increase in upper Arctic Intermediate Water from 46% to 57%.

The larger volume of this water mass is due to deepening of 28.05 kg/m

3

isopycnal from about 300 m to 600 m between winters 1974-75 and 2015-16

Winter 1974-75: ~2 Sv formation of upper AIWWinter 2015-16: ~0.5 Sv formation of upper AIW

2⁰C

-1⁰C

34.7

34.9

Slide23

Heat fluxes from the Japanese 55-year reanalysis (JRA-55) over the Iceland Sea

Winter 1974-75: 131 W/m

2

Winter 2015-16: 61 W/m

2

Slide24

Slide25

Slide26

Slide27

Production of ≈ 0.7 Sv

Slide28

Slide29

Decrease of ≈ 0.1 Sv

Slide30

Historical hydrographic data (1980-2015)

Slide31

Historical hydrographic data (1980-2015)

Slide32

Slide33

Slide34

Slide35

Slide36

Slide37

Slide38

Slide39

Local water mass transformation in the Iceland Sea may not be so important as a source for the NIJ. Rather, the Iceland Sea appears to be more of a transit region for denser water masses formed to the west and the north.

Related Contents

Next Show more