/
CHAPTER 7CHANGE IN PRIVATE INVENTORIESUpdated October 2019Definitions CHAPTER 7CHANGE IN PRIVATE INVENTORIESUpdated October 2019Definitions

CHAPTER 7CHANGE IN PRIVATE INVENTORIESUpdated October 2019Definitions - PDF document

harper
harper . @harper
Follow
343 views
Uploaded On 2021-08-06

CHAPTER 7CHANGE IN PRIVATE INVENTORIESUpdated October 2019Definitions - PPT Presentation

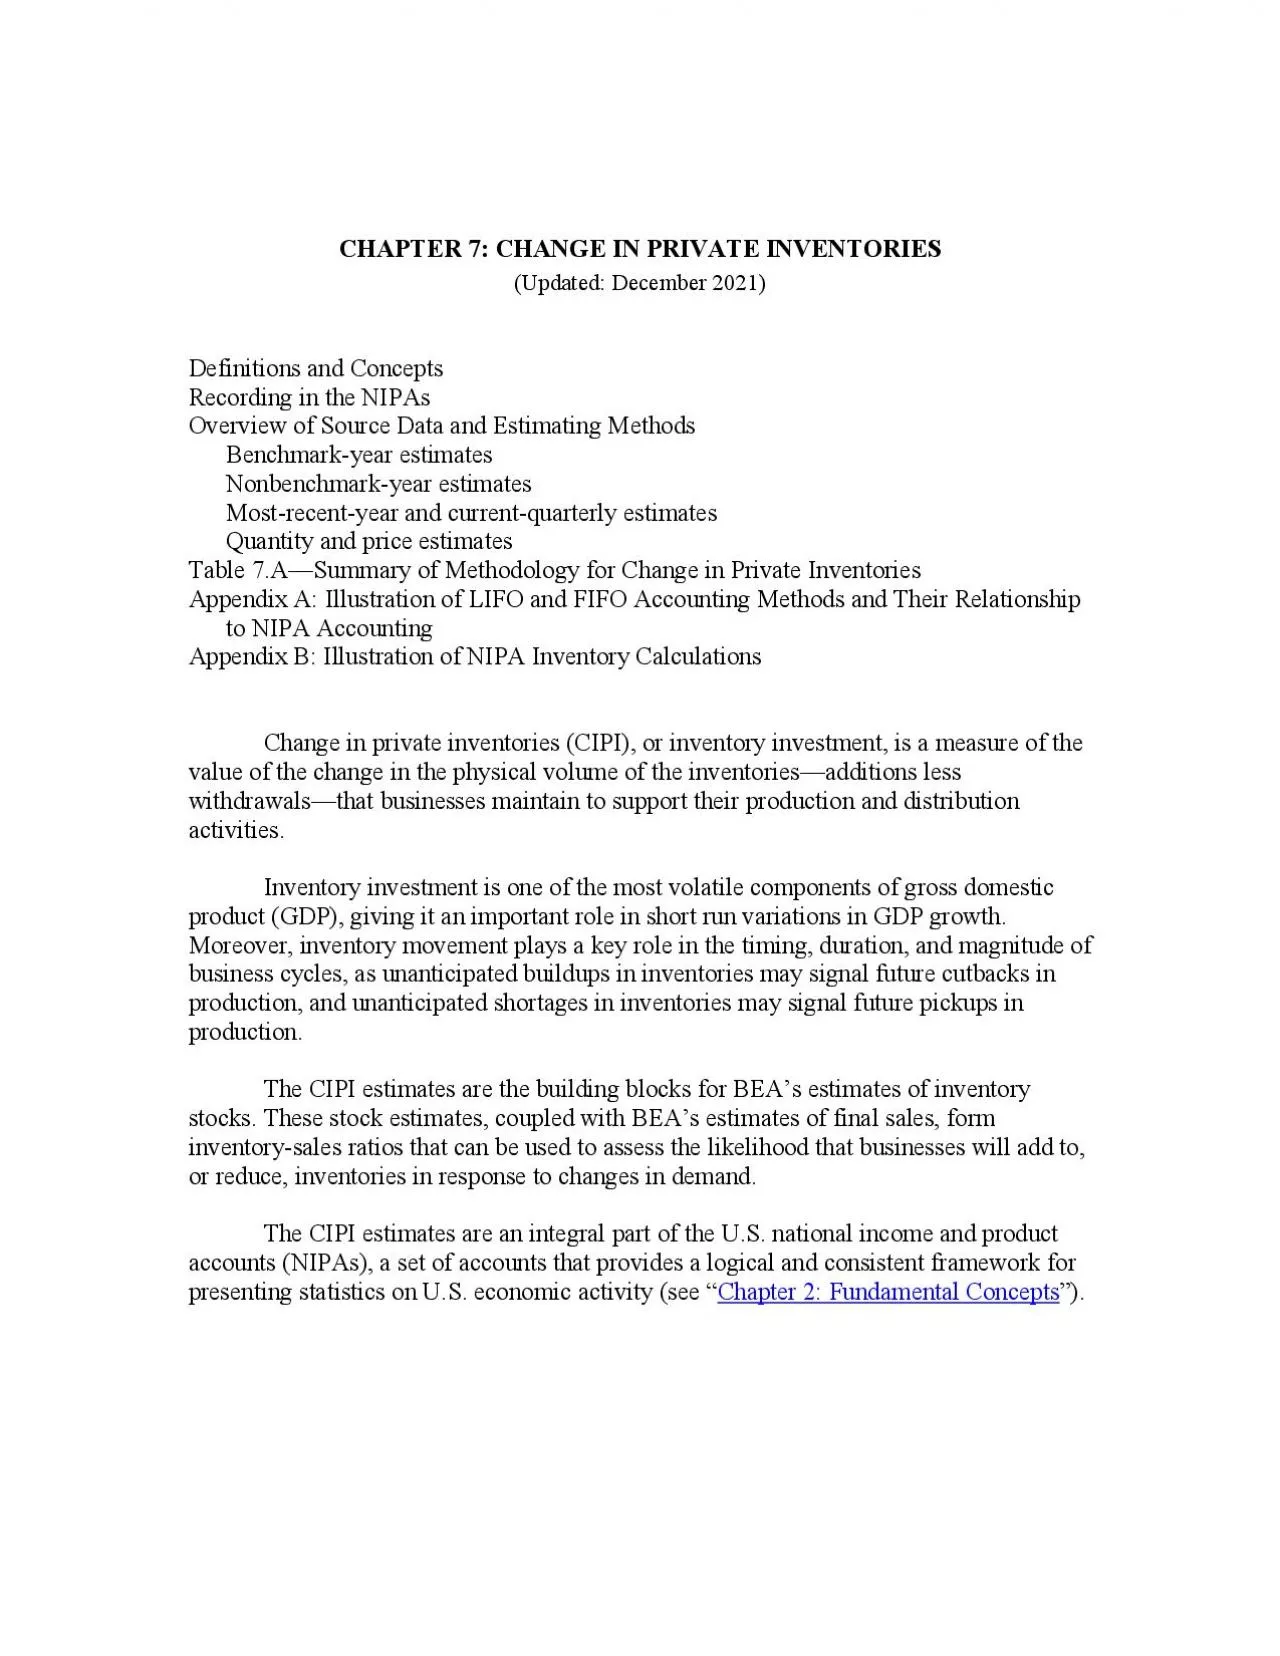
148x0000x0000CHAPTER HANGE IN RIVATE NVENTORIES72Definitions and ConceptsIPIis the NIPAmeasurethe flow or change in the stock of inventories held by private business over a specified periodhe stock o ID: 857967

inventory inventories change estimates inventories inventory estimates change period lifo information current year goods cost x0000 census based prices

Share:

Link:

Embed:

Download Presentation from below link

Download Pdf The PPT/PDF document "CHAPTER 7CHANGE IN PRIVATE INVENTORIESUp..." is the property of its rightful owner. Permission is granted to download and print the materials on this web site for personal, non-commercial use only, and to display it on your personal computer provided you do not modify the materials and that you retain all copyright notices contained in the materials. By downloading content from our website, you accept the terms of this agreement.


Presentation Transcript

1 CHAPTER 7:CHANGE IN PRIVATE INVENTORIES(
CHAPTER 7:CHANGE IN PRIVATE INVENTORIES(Updated: October 2019Definitions and ConceptsRecording in the NIPAs ”). ��CHAPTER HANGE IN RIVATE NVENTORIES 7 - 2 Definitions and ConceptsIPIis the NIPAmeasurethe flow (or change) in the stock of inventories held by private business over a specified periodhe stock of inventories is the value of thegoods owned by private business at the end of a specified period, whether the goods were produced or acquired in that period or in revious periodInventories are maintained by business in order to facilitate the productionand distributionof goods or services. The items held in inventory may be in the form of goods ready for sale (finished goods), of goods undergoing production (work in process), or of goods acquired for use in the production process (materials and supplies) (table 7.1). For example,an auto dealer keeps a variety of makes, models, and parts on hand to meet the varied requirements and preferences of potentialcustomers; an auto manufacturer keeps supplies of inputs, such as steel, on hand for use in manufacturing new vehicles. TablContent of Change in Private Inventories Category of inventory Comments Finished/ready - for - sale goods inventory The value of produced goods held for future sale. Applies to most industries. Work - in - process inventory The value of goods still in the process of production. Applies to manufacturing and publishing industries. Materials and supplies inventory The value of natural resources and basic manufactured goods that are acquired by businessuse as inputs to productionprocess. Applies to manufacturing, mining, construction, utilities , and publishing industries. A general principle underlying NIPA accounting is that production should be recorded at the time it occurs. In the measurement of he other productside components, such as personal consumption expenditures(PCE)and fixed investment, record final sales in the current periodbut these salesmay involve goods that were producedor at least partially producedin earlier periods.he recording of movements of goodsin inventorymaterials and suppliesworkprocess, and inished and from inventories finalsalesprovides the means to allocate production to the period in which it occurred(se

2 e the boxon the next pageforsimpleexampl
e the boxon the next pageforsimpleexample of the allocation In the NIPAs, private business consists of all private entities that produce goods and services for sale at a price intended to at least approximate productioncosts and of certain otherprivateentities that are treated as business in the NIPAs. These other entities include mutual financial institutions, private noninsured pension funds, cooperatives, and nonprofit organizations that primarily serve business (that is, entities classified as nonprofit by the Internal Revenue Service in determiniincome tax liability), Federal Reserve banks, and federally sponsored credit agencies. ��CHAPTER HANGE IN RIVATE NVENTORIES 7 - 3 Simple Example of CIPI Role in Calculating GDP[Billions of dollars] Auto Manufacturer Auto dealer GDP Materials and supplies Finished goods Goods ready for sale Sales 10,000+20,000…..…..+10,000 II ….. - 20,000 +20,000 ….. 0 III…..…..20,000+22,000+2,000 t the beginning of period I, an auto manufacturer has in inventory $10,000 of steel and other materials and supplies that it will use as inputs to produce an automobilen period I, the manufacturer uses the materials and supplies from inventory and its own resources (such as labor) to produce the automobile. The value of the materials and supplies used ($10,000) is subtracted from those inventories, and the value of the produced automobile ($20,000) is added to the finished goods inventory. Thus, total change in inventoriesis +$10,000, and this amountwhich represents production, or value added, in this periodis added to GDPn period II, the manufacturer ships the finished auto to an auto dealer. The value of the manufacturer’s finished goods inventory decreases by $20,000, and the value of the dealer’s inventory of autos ready for sale increases by $20,000. GDP is not affectedn period III, the dealer sells the auto to a consumer for $22,000. The dealer’s inventory declines by $20,000. GDP increases by $2,000 (PCE of $22,000 plus CIPI of $20,000), which represents the value added by the dealer in the form of retail margin.s a result of this accounting for inventories, the process of assembling the materials and supplies into a finished automobile is recorded in

3 period I, when it actually occurred, rat
period I, when it actually occurred, rather than in period III, when the final sale occurred. Similarly, the value added by steel manufacturers and other producers of the materials and supplies that were used as inputs in period I would have been recorded in earlier periods when those goods were producedIn measuringthe level of, the change in, not the level of, inventories provides the appropriate measure of the flow of economic activity that is consistent withthat measured bythe other GDP componentspositiveCIPIindicates that total production(GDP)exceeded the sum of the final salescomponents of GDPin the current periodand that the excessproduction was added to inventories. A negativeCIPIindicates that final salesexceedproduction in the current periodand that e excess sales were filled by drawing downinventories. CIPI is valued in the average prices for the period because units move in and out of inventories continuously over the course of the period. ��CHAPTER HANGE IN RIVATE NVENTORIES 7 - 4 measuring the changein GDP, the change in CIPI (or the change in inventory investment) is the relevant measure.or example, inventoriesmay contribute to an increase in GDP (1) by accumulating in the current period after decumulating in the preceding period, (2) by accumulating more in the current period than in the preceding period, or (3) by decumulating less in the current period than in the preceding period(table 7.Table 7.Effectsof Change in CIPIon Change in GDP[Billions of dollars]Most of the CIPI estimates are derived from information recorded in businessaccounting statements. For an illustration of the relationships between businessaccounting practices and the principles of national accounting and their varying impacts on the measurement of inventories, cost of goods sold, and profits, see appendix A to this chapter.In business accounting, the change inthebook valueof inventoriesthe measure thedifference between inventoryacquisitions andinventory withdrawalsduringtheaccounting periodGenerallywhen is placed in inventory, it is valued on firm’s books at the price prevailing when the good enters into inventory; this is sometimes referred to as “acquisition” or “historical”cost. However, there are a number of different accounting metho

4 dssuch as“last in, first out”
dssuch as“last in, first out” (LIFO) and “first in, first out” (FIFO)that can be used in determining the value ofthe goods thatare withdrawn from inventories and of e goodsthat remain in inventories over time.nothergeneral principle underlying NIPAaccounting that (a) productionshould be valuedat the priceprevailing whenoccursregardless of wheththe goodis sold immediately is entered into inventorfor saleat a later time, and (b) a that withdrawn from inventormustbe valued the price prevailing when it is withdrawn,so holding gains or losses donot affect themeasure ofproductionin the currentperiodIn business accountinga good leaving inventory is frequently valued at historical costthat is, at theprice that prevailed when it entered inventory (see appendix A)he LIFO is a method of accounting valuation of inventories that assumes the goods acquired most recently are used up first, so that withdrawals from inventory are primarily valued at recent acquisition costs. FIFO is a method that assumes the oldest stock in inventories is used up first, so withdrawals from inventory are primarily valued at earlier acquisition costs. Other valuation methods include “average cost,” “market cost,” and “standard cost.” Inventory level[stock]IPI[flow] Contribution of change in CIPI to change in GDP I II III II III III (1)500495500 (2) 500 510 530 10 20 10 (3)500485480 ��CHAPTER HANGE IN RIVATE NVENTORIES 7 - 5 difference between the businessaccounting measure of change in the book value of inventories and the NIPA measure of CIPIthe gain or lossfrom holdingoods in inventory; it termed the inventory valuation adjustment(IVA) (see the section Overview of Source Data and Estimating MethodsRecording in the NIPAsAs described above, CIPI providesa bridge between final sales in the current period and production in the current period.It is one of the few NIPA components that can be negative.In the seven summaryaccounts of theNIPAs, CIPI appears inthe Domestic Income and Product Account (account 1) as a component of gross private domestic investment and inthe Domestic Capital Account (account 6) as a component of gross domestic investment.In the NIPAs, the inventory estimatesaregenerally shown by

5 industry classification, using the Nort
industry classification, using the North American Industry Classification System,rather than by type of product classification(see chapter 2 Thus, for example, “wholesale trade durable goods inventories” signifies “inventories held by industries engaged in the wholesale trade of durable goodsCIPIby industry is presented in NIPA tablegroupStocks of private inventories, along with thecorresponding aggregate estimates of final sales and inventorysales ratios,are shown in tablegroup The following is a list of the principal NIPA tables that present the inventory stimates:Change in Private Inventories by IndustryChange in Real Private Inventories by Industry, Chained DollarsPrivate Inventories and Domestic Final Sales by IndustryReal Private Inventories and Real Domestic Final Sales by Industry, Chained DollarsImplicit Price Deflators for Private Inventories by IndustryIn addition, estimates of change in motor vehicle inventories are shown in tables 7.2.5B and 7.2.6B, and estimates of change in farm inventories are shown in tables 7.3.5 and BEA also prepares estimates of the change in private inventories that are not seasonally adjusted; these are available in Section 8 of the NIPA Interactive Data Tables. The tables present nominal, or “currentdollar” measuresand“real,” or inflationadjusted measuresAdditionally, BEA repares “Underlying Detail” tables for the estimates shown in NIPA table group 5., including detail for change in the book values and for IVA by industry, at a greater level of detail than is shown in the published estimates.BEA publishesestimates ofreal inventories, sales, and inventorysales ratiosfor the manufacturing and trade industries each quarter in the Survey of Current Business ��CHAPTER HANGE IN RIVATE NVENTORIES 7 - 6 (generally in the January, April, July, and October issues). BEA also prepares “Underlying Detail” tables for these estimatesOverview of Source Data and Estimating MethodsAs described earlierin this handbook, the NIPA estimates, including those for CIPI, are prepared using a wide variety of source data (see “ Chapter 3: Principal Source Data ”) and using estimating methods that adjust the source data to the required NIPA concepts and that fill in gap

6 s in coverage and timing (see hapter 4:
s in coverage and timing (see hapter 4: Estimating Methods ). For farm inventories,he estimates of crop and of livestock inventory change are preparedas the product of the change in the physical volume and of the verage pricebased on data from the U.S. Department of Agriculture(USDA)For example, changes in stocks of wheat on the farm are calculated as wheat harvested and available for sale less eat soldvalued at average market prices.The estimates of farm inventories include materials and suppliessuch as feed, fertilizer, and purchased seedthat are used as inputs to farm production. For crops, the estimates also take into account Commodity redit Corporation (CCC) loans to producers who use agricultural commodities as collateral.Because the estimates farm inventories are prepared using data on quantities and current pricesrather than businessaccounting data, an IVA is not calculatedFor nonfarm industries, the estimates of inventory change are generally prepared by beginning with dataon the endperiod book value of inventories, as reported by private business using a variety of accounting methods.he inventory dataare then adjustedannually for 417detailedindustries and monthly for 82aggregatedindustriesto value the inventories at a uniform set of prices and to remove holding gains or lossesMore specifically, for manufacturing and tradedustries, data on the book value of inventory stocks, inventory turnover,and on the methods of inventory valuation are collected in economic censusesandannual surveys conducted bythe Census BureauBusinesses that use LIFO accounting also provide the Census Bureau with an estimate of the “LIFO reserve,” an adjustment for converting their inventories to a nonLIFO valuation. ata on inventory stockat the end of the month (and quarter) arecollected in Placement of crops as collateral for CCC loans is treated as an addition to farm inventories. Redemption of the crop after loan repayment or forfeiture of the crop after loan default are each treated as a withdrawal from farm inventories. The data on the physical quantities of crops placed, redeemed, and forfeited are from USDA and are valued using average market prices. As a practical matter, the source data for endof period inventories reflect losses that result fromdamage, theft, a

7 nd other causes, as well as business wri
nd other causes, as well as business writedowns. When these episodic events can be identified, BEA adjusts the source data to remove these affects. ��CHAPTER HANGE IN RIVATE NVENTORIES 7 - 7 the Census Bureas monthly surveysIn the Census Bureau’s published reportsof manufacturing and trade inventories, all inventories are valued on a “nonLIFObasisFor most other nonfarm industries, annual data on the book value of inventory stockareavailablefrom Internal Revenue Service (IRS) tabulations of business tax returns. The data includeinformation on inventory stocks, the proportions of those stocks that are valued on a LIFO basisand inventory turnover.For mostnonfarmindustries, the principaprice data used inestimating NIPA inventoriesare producer price indexes(PPIs)and import price indexes, both from the Bureau of Labor Statistics (BLSor the manufacturing and publishing industries,theprices forworkprocess and finished goodsinventories consist of a combination of the following: the cost of materials and supplies, based on PPIs; labor costs, based onBEAconstructed unit labor cost index; and overhead costsincluding rent, depreciation charges, and repair costsprimarily based on PPIsTheBEA labor cost indexescovercompensation of production workers, supervisors, and nonproduction personnel working at the plant and are based on BEA wage dataAt the most detailed level for which BEA prepares estimatesprocedure for nonfarminventoriesgenerallyconsists of the followingsteps that yield currentdollar and constantdollarestimates for CIPI andfor the stocks of goods held in inventory. For an illustration of the estimation procedure, see appendix B to this chapter.Separating Census Bureau publishedventories(which are on a nonLIFO basis)to those that were reported on a LIFO basis and those that were reported using other accounting methods.Construction of currentperiod inventory price indexes for each industryand for manufacturingand for publishing, each stage of fabrication. Construction of monthly cost indexesfor each industryandfor manufacturing and publishing, each stage of fabricationRevaluation of the value inventories to yield constantdollar and currentdollar change in inventories.Calculation of the IVA.Calculation of currentdollar and constantdollar stocksAs no

8 ted earlier, the IVA is the measure of t
ted earlier, the IVA is the measure of the holding gainor losses that are removedfrom the businessaccounting measure of inventory changeis calculated for all inventoryaccounting methods, regardless of whether inventories are accumulating or decumulating over the recording period. However, underLIFO accounting, inventories are accumulatingwithdrawalsare already valued at currentperiod prices; thus,CIPI andchange in the book valueare equaland the IVA is zero(see appendix A). The Census Bureau reports inventories on a nonLIFO basis because during periods of rising inventories and prices, LIFO accounting may result in stock estimates that are considerably undervalued (see appendix A). ��CHAPTER HANGE IN RIVATE NVENTORIES 7 - 8 In the NIPAs, theIVA is also used on the income side of the accounts in order to exclude the inventory holding gains (or losses) from business income in the calculation of corporate profits and ofnonfarmproprietors’ income.Since profit and income data come from IRStabulations, the productside IVA must be adjusted for any accountingbasis differences between the IRS data and the CensusBureaudata. (The estimates for nonfarm industries other than manufacturing and trade are already based on IRS data, soin most casesno adjustment is needed for those industries.)In estimating the stocks of private inventories, the constantdollarestimates are derivedfirst,using the perpetual inventory methodthat is, by adding the change in real private inventories during the period to the real stocks at the end of the preceding period (see “perpetual inventory method” in hapter 4 ). The endperiod currentdollar estimates of the stock of private inventories are then derived by “reflatithat is, by multiplying estimates of theendperiod realstockby appropriate price indexes. Table 7.Aat the end of this chaptersummarizes the source data and estimating methods that are used to prepare the benchmarkyearbenchmarkyear, current quarterly, and quantity (inflationadjusted)estimates for the CIPI categories that are shown by industry in NIPA table group The source data and methods for the current quarterly estimates reflect both seasonally adjusted and not seasonally adjusted estimates unless otherwise noted.BenchmarkyearestimatesFor manufacturing

9 , data on the book value of inventory st
, data on the book value of inventory stocks and on the methods of inventory valuation are available from the Census Bureau’s conomic ensus.Manufacturing establishments report their endyear inventory levels and their inventories by stage of fabrication (finished, workprocess, and materials and supplies). Information on the distribution of costs in the manufacturing sector among materials, labor,and overhead is used in the calculation of cost of goods sold and of inventory turnover ratios (see appendix B). The commodity composition of materials held in inventory is assumed to be the same as that for materials purchased by the industry, which, in turn, is derived from BEA’s benchmark inputoutput accounts, based on information from the economic censuses on materials “consumed” by industry. This information is used in the calculation of materials held in inventory.For wholesale and retail trade, data on the book value of inventory stocks and the methods of inventory valuation are available from the conomic ensus.Retail and wholesale trade establishments report their inventories of goods for sale at the end of the See NIPA table 6.14D , “Inventory Valuation Adjustment to Nonfarm Incomes by Legal Form of Organization and by Industry,” available on BEA’s websiteat www.bea.gov . ��CHAPTER HANGE IN RIVATE NVENTORIES 7 - 9 year.LIFO users also report the LIFO reserve and the LIFO value after adjustment for the reserve. For wholesale and retail trade, data on purchases from the Economic Census are used in the calculation of costof goods sold and of inventoryturnover ratios. In addition, data on productline sales by industry are used in the calculation ofcommodities held in inventory.For the miningandconstructionindustries, the inventoryestimatesfor benchmark yearsare based oninformation fromthe conomic ensus.For the publishing industry, the inventory estimates are based on information from the ervice nnual urvey.For all other nonfarm industries, the estimatesfor all years except the most recent yearare based on IRS tabulations ofincometax returns for corporations and for sole proprietorships and partnerships.For farm inventories, the estimates for all years (benchmark and nonbenchmark) are based on USDA annual reports.An

10 nual changes in farm inventories of crop
nual changes in farm inventories of crops are estimated as crops harvested in the period and available for sale (that is, not including crops retained for personal consumptionlesscrops sold in the periodplus net CCC loan transactionsTheannual quantity changesfor each cropare valued at average market prices received by farmers during the calendar year. Annual changes in farm inventories of livestock are estimated from USDA surveys ofinventory stocks on farms.For each livestock commodity, annual quantity changes are valued at average market price per head.NonbenchmarkyearestimatesFor years other than benchmark yearsand the most recent yeartheinventory estimates for themanufacturingtrade, and publishingdustriesare primarily based on the Census Bureaunnual urvey of anufactures, nnual holesale rade urvey, nnual etail rade urvey, and ervice nnual urveyespondentsto these surveysreport LIFO, LIFO reserve,and nonLIFO valuations separately.In addition, respondents in the manufacturing sector report information on the distribution of costs among materials, labor, and overhead and those in retail and wholesalereport purchases; this information is used in the calculation of costof goods sold and of inventoryturnover ratios.For the mining, utilities,and construction industries,as well as for other nonfarm industries,estimates for all nonbenchmark years except the most recent year are based on IRS tabulations of income tax returns for corporations and for sole proprietorships and partnerships. The wholesale trade inventory data published by the Census Bureau include inventories that are owned by U.S. establishments but are held abroad. BEA adjusts these wholesale trade data in order to exclude those inventories. The retail trade inventory data published by the Census Bureau exclude inventories that are owned byU.S. establishments but are held abroad. ��CHAPTER HANGE IN RIVATE NVENTORIES 7 - 10 The sources and methods for deriving the nonbenchmarkyear estimates of farm inventories are the same as those for the benchmark estimates (see above). Mosrecentyear and currentuarterly estimatesThe seasonally adjusted inventory estimates for the mostrecentyear and for the currentquarters forthemanufacturing and trade dustriesexcept those for retail autodealersare based on t

11 he following Census Bureau surveys: onth
he following Census Bureau surveys: onthly urvey of anufacturers’ hipments, nventories, and rders; onthly holesale rade urvey; onthly etail rade urvey; and the Census Bureau’sonthlydvance conomic ndicators eportThe data for manufacturing, wholesale trade, and retail trade are summarized in the Census Bureau’s monthly “Business Sales and Inventories” release.The quarterly estimates for the manufacturingand tradedustriesare calculated as endmonth inventories for the final month of the quarterless endmonth inventories for the final month of the preceding quarter.For retail autodealers,seasonally adjustedinventory estimates for the most recent year and for the current quarters are primarily based oweighted average ofBEA’s unitbased estimates, which are based on the monthly unit data from Wards’ Automotive Reportsand of Census Bureau total motor vehicle inventoriesFor utilities, the seasonally adjusted quantity estimates are prepared first, using data on changes in the physical stocks of coal, petroleum, and natural gas and on baseyear prices from the Energy Information Administration. Thcurrentdollar estimates are then derived by “reflation”that is, by multiplying the quantity estimates by appropriate price data from the Bureau of Labor Statistics (BLS).For all other nonfarm industries, seasonally adjusted estimatesfor the most recent year and for the current quartersarepreparedtarting with thepreviousannual level and by assuming that inventoriesmove proportionately with certain other indicatorseries chosen for each industryor by judgmental trend.e indicatorseries include inventory information from the Census Bureau’s uarterly inancial eportand monthly measures of activity fromthe Census Bureau’s construction statistics and from BLS industry wage dataFor seasonally adjusted farm inventories,quarterly estimates of cropinventorieswhich are calculated only for total crops, arebased on a BEA quarterly allocation of USDA annual projectionof crop output and cash receipts.uarterly estimates of livestock inventories arebased on USDA datatype of livestock The Census Bureau’s Advance Economic Indicators Report provides advance statistics for U.S. International Trade in Goods, domestic retail inventories, and domestic who

12 lesale inventories. Advance measures of
lesale inventories. Advance measures of domestic retail and wholesale inventories were first provided in July 2016; the Census Bureau provides the report to BEA in time for it to be incorporated into its advance estimates of GDP. ��CHAPTER HANGE IN RIVATE NVENTORIES 7 - 11 The not seasonally adjusted (NSAestimates of inventoriesare derived using the same methodsas the seasonally adjusted current quarterly estimates, using the not seasonally adjusted versions of the same indicators.Quantity and priceestimateThe quantityestimates for the detailed inventory componentsareprimarilyderived by deflation, asshown in appendix. (For a general description of the deflation method, see “Estimates for detailed components” in chapter 4.)In the NIPAs, the aggregate measures for most of the components of real GDP arecalculated from the detailed components as chaintype quantity and price indexes(see“Estimates for NIPA aggregates” inchapter 4).However, the detailed CIPI estimatesmay ntain negative values (which couldrequire the Fisher formula to take the square root of a negative number).Thereforethe endof periodchainweighted estimates of inventory stocks are calculated first, and the CIPIchaineddollar estimatesarethen calculated as the differencebetwethese estimatesUnderthis procedure, inventory stocks are used as weights for inventory flows, though the composition of the stocks may differ from the composition of theinventory investmentflows. The inability to calculate Fisher quantity indexes for CIPI doesnot extend to higher level aggregates (such as gross private domestic investment and GDP) that include CIPI as a component, because the negative values of CIPI are small relative to the levels of the other components of those aggregates. ��CHAPTER HANGE IN RIVATE NVENTORIES 7 - 12 Table 7.ASummary of Methodology Used to Prepare Estimates of Change in Private Inventories Line in NIPA table group 5.6 Component Current - dollar estimates Quantity and priceestimates (quantity estimate prepared by deflating with the price index unless otherwise indicated) Benchmark year Indicator series used to interpolate and extrapolate * Nonbenchmark years except the most recent year Most recent year Current quarterly estimate

13 s 2 Farm USDA change i
s 2 Farm USDA change in inventories adjusted to exclude Commodity Credit Corporation (CCC) forfeitures and to include net CCC loans at market value. Same as for benchmark year. Same as for benchmark year. Crops : BEA quarterly allocations of USDA annual projections of crop output and cash receipts. Livestock : USDA quarterly data. USDA average market prices. 3 Mining, utilities, and construction : Mining Inventories from EC, revalued to current replacement cost using EC information on accounting methods, commodity composition, and turnover and using information on prices, primarily PPIs. Inventories from IRS tabulations of business tax returns, revalued to current replacement cost based on IRS LIFO valuation proportions and turnover and using information on prices, primarily PPIs. Census Bureau Q uarterly inancial R eport survey of mining corporations, revalued as in nonbenchmark years For third and second estimates, same as for most recent year; for advance estimate, judgmental trend. PPI for coal mining, PPI for nonmetallic mineral mining and quarrying, PPI for metal ore mining, PPI for oil and gas extraction, PPI for petroleum refinery primary products, PPI for parts and attachments for mi ning, machinery, and equipment, and PPI for mining machinery and equipment. Utilities Inventories from IRS tabulations of business tax returns, revalued to current replacement cost based on IRS LIFO valuation proportions and turnover and using inf ormation on prices, primarily PPIs. Same as for benchmark year. Monthly physical quantities and base - year prices from Energy Information Administration (EIA) combined with PPIs for electric utilities. Same as for most recent year. For annual except most recent year, deflation using PPI for coal, PPI for natural gas, and PPI for heavy fuel oils; for most recent year and current quarterly, direct valuation, using quantities and prices of stocks of coal, petroleum, and natural gas from EIA. Con struction Inventories from EC, revalued to current replacement cost using IRS information on accounting methods and Inventories from IRS tabulations of business

14 tax returns, revalu ed to current repl
tax returns, revalu ed to current replacement cost based on IRS LIFO Judgmental trend. Same as for most recent year. PPI for construction materials. ��CHAPTER HANGE IN RIVATE NVENTORIES 7 - 13 Table 7.ASummary of Methodology Used to Prepare Estimates of Change in Private Inventories Line in NIPA table group 5.6 Component Current - dollar estimates Quantity and priceestimates (quantity estimate prepared by deflating with the price index unless otherwise indicated) Benchmark year Indicator series used to interpolate and extrapolate * Nonbenchmark years except the most recent year Most recent year Current quarterly estimates EC information on turnover and using information on prices, primarily PPIs. valuation proportions and turnover and using information on prices, primarily PPIs. 4 Manufacturing: 5 Durable goods industries Inventories from EC, revalued to current replacement cost using EC information on accounting methods, commodity composition, and turnover and using information on prices, primarily PPIs and BEA unit labor costs. Inventories from ASM, revalued to current replacement cost based on ASM LIFO proportions and turnover and using information on prices, primarily PPIs and BEA unit labor costs. Inventories from Census Bureau onthly S urveys of M anufacturers’ S hipments, nventories, and O rders, revalued as in nonbenchmark years. For second and third estimates, same as most recent year or advance estimate, 1st and 2nd month of quarter same as most recent year; 3rd month based on Census Bureau’s Advance Durable Goods Repor . Various PPIs. 6 Nondurables goods industries Inventories from EC, revalued to current replacement cost using EC information on accounting methods, commodity composition, and turnover and using information on prices, primarily PPIs and BEA unit labor costs. Inventories from ASM, revalued to current replacement cost based on ASM LIFO proportions and turnover and using information on prices, primarily PPIs and BEA unit labor costs. Inventories from Census Bureau onthly S urveyof M anufacturers’ S hipments, nventories, and O rders, revalued

15 as in nonbenchmark years Crude pe tr
as in nonbenchmark years Crude pe troleum : f or second and third estimates, composite refiner crude acquisition cost from Energy Information Administration ; for advance estimate, composite refiner acquisition cost for two months and PPI for crude petroleum for the most recent month. Other components For second and thirdestimates, same as most recent year. For advance estimate, and 2month of quarter same as most recent year; month based on judgmental trend . Crude petroleum : c omposite refiner acquisition cost from Energy Information Administration. Other components : various PPIs. ��CHAPTER HANGE IN RIVATE NVENTORIES 7 - 14 Table 7.ASummary of Methodology Used to Prepare Estimates of Change in Private Inventories Line in NIPA table group 5.6 Component Current - dollar estimates Quantity and priceestimates (quantity estimate prepared by deflating with the price index unless otherwise indicated) Benchmark year Indicator series used to interpolate and extrapolate * Nonbenchmark years except the most recent year Most recent year Current quarterly estimates 7 Wholesale trade: 8 Durable goods industries Inventories from EC and AWTS, revalued to current replacement cost using EC information on accounting methods, commodity composition, and turnover and using information on prices, primarily PPIs and IPIs. Inventories from AWTS, revalued to current replacement cost based on AWTS LIFO proportions and turnover and using information on prices, primarily PPIs and IPIs. Merchant wholesale : i nventories from MWTS, revalued as in nonbenchmark years. Nonmerchant wholesale : estimated CIPI based on manufacturing finished goods CIPI and on judgmental trend. Merchant wholesale : second and third estimates, same as most recent yearor advance estimate, and 2month of quarter same as most recent year; 3rd month based on Census Bureau’s monthly Advance Economic Indicators Report. Nonmerchant wholesale : Same as most recent year. Various PPIs and IPIs. 9 Nondurable goods industries Inventories from EC and AWTS, revalued to current replacement cost using EC information on accounting methods, commodi

16 ty composition, and turnover and using
ty composition, and turnover and using information on prices, primarily PPIs and IPIs. Inventories f rom AWTS, revalued to current replacement cost based on AWTS LIFO proportions and turnover and using information on prices, primarily PPIs and IPIs. Merchant wholesale : inventories from MWTS, revalued as in nonbenchmark years. Nonmerchant wholesale : estimated CIPI based on manufacturing finished goods CIPI and on judgmental trend. Merchant wholesale : For second and third estimates, same as most recent year or advance estimate, 1st and 2nd month of quarter same as most recent year; 3rd month based on Census Bureau’s monthly Advance Economic Indicators Report. Nonmerchant wholesale : Same as for most recent year. Various PPIs and IPIs. 10 Retail trade: 11 Motor vehicle and parts dealers Inventories from ARTS, revalued to current replacement cost using ARTS information on accounting methods and turnover, EC information on commodity composition, and using Inventories from ARTS, revalued to current replace ment cost based on ARTS LIFO proportions and turnover and using information on prices, primarily PPIs and IPIs. New motor vehicles : weighted average of BEA unit based motor vehicle estimates and of inventories from MRTS, revalued as in nonbenchmark years . Other components : inventories from MRTS, New motor vehicles : For second and third estimate, same as most recentyearor advance estimate, 1st and 2nd month of quarter same as most recent year; 3rdmonth based on BEA unitbased motor vehicle inventories and inventories from Census New motor vehicles : PPI for new autos, PPI for light trucks, PPI for parts, IPI for new autos and light trucks, and CPI for used motor vehicles. Other components : PPI for boats, PPI for motor cycles, PPI for RVs, PPI for other transportation equipment, PPI ��CHAPTER HANGE IN RIVATE NVENTORIES 7 - 15 Table 7.ASummary of Methodology Used to Prepare Estimates of Change in Private Inventories Line in NIPA table group 5.6 Component Current - dollar estimates Quantity and priceestimates (quantity estimate prepared by deflating with the price index unless otherwise indicated) Benc

17 hmark year Indicator series used to inte
hmark year Indicator series used to interpolate and extrapolate * Nonbenchmark years except the most recent year Most recent year Current quarterly estimates information on prices, primarily PPIs and IPIs. revalued as in nonbenchmark years. Bureau’s monthly Advance Economic Indicators Report . Other components : For second and third estimate, same as most recent or advance estimate, 1 and 2month of quarter same as most recent year; third month based on inventories from Census Bureau’s monthly Advance Economic Indicators Report. for parts and accessories, IPI for parts and accessories, and IPI ot her transportation equipment. 12 Food and beverage stores Inventories from ARTS, revalued to current replacement cost using ARTS information on accounting methods and turnover, EC information on commodity composition, and using information on prices, primarily PPIs and IPIs. Inventories from ARTS, revalued to current replacement cost based on ARTS LIFO proportions and turnover and using information on prices, primarily PPIs and IPIs. Inventories from MRTS, revalued as in nonben chmark years. For second and third estimate, same as benchmark year or advance estimate, 1st and 2nd month of quarter same as most recent year; third month based on Census Bureau’s monthly Advance Economic Indicators Report. Various PPIs and IPIs. 13 General merchandise stores Inventories from ARTS, revalued to current replacement cost using ARTS information on accounting methods and turnover, EC information on commodity composition, and using information on prices, primarily PPIs and IPIs. Inventories from ARTS, revalued to current replacement cost based on ARTS LIFO proportions and turnover and using information on prices, primarily PPIs and IPIs. Inventories from MRTS, revalued as in nonbenchmark years. For second and third est imate, same as benchmark year or advance estimate, 1st and 2nd month of quarter same as most recent year; 3rdmonth based on Census Bureau’s monthly Advance Economic Indicators Report. Various PPIs and IPIs. ��CHAPTER HANGE IN RIVATE NVENTORIES 7 - 16 Table 7.ASummary of Methodology Used

18 to Prepare Estimates of Change in Priva
to Prepare Estimates of Change in Private Inventories Line in NIPA table group 5.6 Component Current - dollar estimates Quantity and priceestimates (quantity estimate prepared by deflating with the price index unless otherwise indicated) Benchmark year Indicator series used to interpolate and extrapolate * Nonbenchmark years except the most recent year Most recent year Current quarterly estimates 14 Other retail stores Inventories from ARTS, revalued to current replacement cost using ARTS information on accounting methods and turnover, EC information on commodity composition, and using information on prices, primarily PPIs and IPIs. Inventories from ARTS, revalued to cur rent replacement cost based on ARTS LIFO proportions and turnover and using information on prices, primarily PPIs and IPIs. Inventories from MRTS, revalued as in nonbenchmark years. For second and third estimate, same as benchmark year or advance estim ate, month of quarter same as most recent year; 3rd month based on Census Bureau’s monthly Advance Economic Indicators Report. Various PPIs and IPIs. 15 Other industries : Publishing I nventories from SAS, revalued to current replacement cost based on IRS LIFO proportions and SAS turnover and using information on prices, primarily PPIs and BEA unit labor costs. Same as for benchmark year. Census Bureau quarterly financial report survey of publishing corporations, revalued as i n benchmark years. For third and second estimates, same as for most recent year; for advance estimate, judgmental trend. Various PPIs. Other components I nventories from IRS tabulations of business tax returns, revalued to current replacement cost based on IRS LIFO valuation proportions and turnover and using information on prices, primarily PPIs. Same as for benchmark year. J udgmental trend . J udgmental trend . ��CHAPTER HANGE IN RIVATE NVENTORIES 7 - 17 *The description “Same as for benchmark year” indicates that the estimate is prepared using a methodology similar to that used for the benchmark estimate rather than by using an indicator series to interpolate or extrapolate the benchmark estima

19 te.ARTSAnnual Retail Trade Survey, Censu
te.ARTSAnnual Retail Trade Survey, Census BureauAnnual Survey of Manufactures, Census BureauAWTSAnnual Wholesale Trade Survey, Census BureauBLSBureau of Labor StatisticsEconomic Census, Census BureauIPIImport Price Index, BLSIRSInternal Revenue ServiceLIFOLast In, First OutProducerPrice Index, BLTSMonthly Retail Trade Survey, Census BureauMWTSMonthly Wholesale Trade Survey, Census BureauServices Annual Survey, Census BureauUSDAU.S. Department of Agriculture ��CHAPTER HANGE IN RIVATE NVENTORIES 7 - 18 Appendix A: Illustration of LIFO and FIFO Accounting Methods and Their Relationship to NIPA AccountingThis appendix illustrates the basic aspects of lastlastout (LIFO)andfirstfirstout (FIFO)inventory accounting and their relationship to NIPA inventory accounting. The illustration is based onone retail establishment that holds only one type of good in inventory. The unit cost and the sales priceincrease over time, but theyare equalto each otherin each period, so any profit (or loss) made by the establishment is solely the result of changes in the prices of goods held in inventoryExhibit 1 provides information ongoodspurchased by the establishment in periods 0 to 3; these goods then wesold in that same period or were added to inventoryIt also provides informationon goods sold by the establishment in periods 1 to 3; these goods were purchased in that same period or were withdrawn from the inventoryof goods that were purchased in earlier periodsExhibit 1Purchases and Sales PurchasesSales Period QuantityUnit costBook value QuantityPriceRevenue 100$100…..…..….. $20$20 $30$15 $40$80 Exhibit 2 presents the LIFOaccounting treatment for the cost of goods sold (COGS), the book value of inventories, and the resulting measure of profit for the establishment.Exhibit 2Inventory Accountingon a LIFO BasisPeriodBook value at beginning of periodPurchasesCost of goods sold (COGS)Quantity in inventoryBook value at end of periodChange in book value Recorded profit revenueminus COGS) $100100$100…..….. $100$20$20100$100 $100$30$15105$115$15 $115$40$60$95$20 ��CHAPTER HANGE IN RIVATE NVENTORIES 7 - 19 In period 1, the beginning inventory consists of 100 units at $1 each = $100; 10 units are sold at $2 each = $20; under LIF

20 O, these 10 units are the most recent go
O, these 10 units are the most recent goods acquired, so COGS is 10 units at $2 each = $20; recorded profit is $20 $20 = $0; and inventory at end of period 1 (and at beginning of period 2) consists of 100 units at $1 each = $100. In period 2, 5 units are sold at $3 each = $15; COGS is 5 units at $3 each = $15; recorded profit is $15 $15 = $0; and inventory at end of period 2 (and abeginning of period 3) consists of 100 units at $1 each + 5 units at $3 each = In period 3, 20 units are sold at $4 each = $80; COGS is 10 units at $4 each + 5 units at $3 each + 5 units at $1 each = $60; recorded profit is $80 $60 = $20; and inventory atend of period 3consists of95 units at $1 eachExhibit 3 presents the FIFOaccounting treatment for the COGS and the book value of inventories for the establishment.Exhibit 3Inventory Accounting on a FIFObasis Period Book value at beginning of periodPurchasesCost of goods sold (COGS)Quantity in inventoryBook value at end of periodChange in book value Recorded profit revenueminus COGS) $100100$100…..….. $100$20$10100$110$10$10 $110$30105$135$25$10 $135$40$20$155$20$60 In period 1, the beginning inventory consists of 100 units at $1 each = $100; 10 units are sold at $2 each = $20; under FIFO, these 10 units are the earliest goods acquired, so COGS is 10 units at $1 each = $10; recorded profit is $20 $10 = $10; and inventory at end of period 1 (and at beginning of period 2) consists of 9units at $1 each + 10 units at $2 each = $11In period 2, 5 units are sold at $3 each = $15; COGS is 5 units at $1 each = $5; recorded profit is $15 $5 = $10; and inventory at end of period 2 (and at beginning of period 3) consists of 85 units at $1 each + 10 units at $2 each + 10 units at $3 each = $135. In period 3, 20 units are sold at $4 each = $80; COGS is 20 units at $1 each = $20; recorded profit is $80 $20 = $60; and inventory at end of period 3 consists of units at $1 each+ 10 units at $2 each + 10 units at $3 each + 10 units at $4 Exhibit 4 illustrates the concepts that the NIPAs attempt to capture in inventory accounting. The change in private inventories (CIPI) in each period is equal to the change in the quantity of inventory times the current price in that period. The inventory valuation ��CHAPTER HANGE IN RIVATE NVENTORI

21 ES 7 - 20 adjustment (IVA) is equal
ES 7 - 20 adjustment (IVA) is equal to CIPI minus the change in the book value of inventory. Note that when prices are risingfrom period to period, as in this illustration, the FIFO IVA is negative.Note also that when inventories are unchanged or increasing from period to period, the LIFO IVA is equal to , and when prices are rising and inventories are decreasing, the LIFO IVA is negativeExhibit 4NIPA Accounting ConceptPeriod Quantity in inventory Change in quantity in inventoryPrice Change in private inventories Inventory valuation adjustment (LIFO basis) Inventory valuation adjustment (FIFO basis) 100…..…..…..…..….. 100 105$15 3 95 –10 $4 –$40 –$20 –$60 In period 1, the quantity of goods held in inventory is unchanged, so CIPI is Under LIFO, the change in the book value is $0, and the LIFO IVA is $0(see exhibit 2). Under FIFO, the change in the book value is $10, and the FIFO IVA is$10 = see exhibit 3)In period 2, the quantity of goods held in inventory increases by 5 unitsand the price is $3 per unit, so CIPI is $15. Under LIFO, the change in the book value is $15, and the LIFO IVA is $15 $15 = Under FIFO, the change in the value is $25, and the FIFO IVA is $15 $25 = In period 3, the quantity of goods held in inventory decreases by 10 unitsand theprice per unit is $4, so CIPI $40. Under LIFO, the change in the book value is $20, and the LIFO IVA is $20) = Under FIFO, the change in the book value is $20, and the FIFO IVA is $20 = For the purposes of this illustration, information on physical quantities and on prices is provided for the individual good held in inventory. However, data on the physical quantities of goods moving through inventory are generally not available, and the NIPA estimates are derived using data on book values from the Census Bureau or from the IRS. For an illustration of theactualmethod used in accounting for inventories in the NIPA, see appendix B. ��CHAPTER HANGE IN RIVATE NVENTORIES 7 - 21 Appendix B: Illustration of NIPA Inventory CalculationsThis appendix illustrates the basic steps in preparing endquarter inventory estimates for an industry using the following assumptions.Lastin, firstout (LIFO) and firstin, firstout (FIFO) are the only accounting metho

22 ds used in this industry. The Census Bur
ds used in this industry. The Census Bureau published value of nonLIFO inventories (that is, the value of inventories without using LIFO accounting) for this industry is $110 in May and $130 in June.The percentage of inventories for this industry that are accounted for on a LIFO basis is 10 percent, and the LIFO reserve (the adjustment that converts a LIFO valuation to a nonLIFO valuation) is $10.The FIFO turnover ratio (ending inventory divided by monthly cost of goods sold), which is used in deriving the turnover period and the turnover pattern for this industryis 1.4he turnover period(the average time a good is held in inventory),which is used in deriving the monthly cost index,is 4 monthshe turnover pattern(the pattern of how goods are withdrawn from inventory),is also used in deriving the monthly cost index. The pattern, starting with the most recent month, is0.23, 0.62, 0.14, and 0.01.The inventory composition for this industry is 40 percent of commodity A and 60 percent of commodity B. The monthly producer price indexes (PPIs) for each of these commodities are shown in thefirst two columns of exhibit 2.Step 1:Separating Census Bureau published inventories into those that were reported on a LIFO basis and those that were reported using other accounting methodsExhibit 1Time period Census Bureau nonLIFO inventories LIFO reserveBook value of inventoriesLIFO inventoriesFIFO inventories May 110 10 100 10 90 June 130 10 120 12 108 Book value of inventories. Calculated as Census Bureau nonLIFO inventories minus LIFO reserve: for June, $130 $10 = $120. Of this $120, $12 is valued on a LIFOaccounting basis ($120 x 0.10), and the remaining $108 is valued on a nonLIFO (FIFO) accounting basis. ��CHAPTER HANGE IN RIVATE NVENTORIES 7 - 22 Step 2: Construction of currentperiod inventory price indexes for each industry, and for manufacturing and publishing, each stage of fabricationExhibit 2Time periodPPI for commodity A PPI for commodity B Monthly price index End - of - month price index Average monthly price index Monthly cost index January 108.0 109.0 108.6 109.3 …. February 110.0 110.0 110.0 111.3 110.30 March 115.0 111.0 112.6 113.6 112.45 April 120.0 111

23 .0 114.6 115.3 114.45 May 12
.0 114.6 115.3 114.45 May 122.0 112.0 116.0 117.9 116.60 114.623 June 130.0 113.0 119.8 120.8 119.35 116.880 July 132.0 115.0 121.8 …. …. nthly price index. Calculated as the weighted average of the commodity PPIs: for June, (130.0 x 0.4) + (113.0 x 0.6) = 119.8. 10 month price index. Calculated as a 2month forward moving average of the monthly price index: for June, (119.8 + 121.8) / 2 = 120.8. verage monthly price index. Calculated as a 2month average of the end month price index: for June, (117.9 + 120.8) / 2 = 119.35. Step 3: Construction of monthly cost indexes for each industry, and for manufacturing and publishing, each stage of fabrication onthly cost index (acquisition cost)Calculated as the average of the monthly price indexes for the turnover period weighted by the turnover pattern: for June, (112.45 x 0.01) + (114.45 x 0.14) + (116.60 x 0.62) + (119.35 x 0.23) = 116.880. 11 In the NIPA calculations, industrybased PPIs rather than commoditybased PPIs are used for some industries. In calculating the average price at the detailed industry level, BEA applies a fixedweight aggregation structure, based on weights from the economic censuses, when combining specific commodities held within an industry rather than a Fisher aggregation. This illustrated calculation is that used under FIFO accounting. BEA has a specific methodology for constructing the cost indexes under each of the inventoryaccounting methods. ��CHAPTER HANGE IN RIVATE NVENTORIES 7 - 23 Step 4Revaluation of the bookvalue inventories to yield constantdollar and currentdollar change in inventoriesExhibit 3Time period Current - dollar change in inve ntories Constant - dollar change in inventories Change in book value of inventories IVAConstantdollar stocksCurrentdollar stocks June 18.57 15.56 20 – 1.43 95.56 115.44 Change in FIFO inventoriesConstantdollar change is calculated as the difference between the FIFO book values for each month deflated by the monthly cost index: for June, ($108 / 1.16880) ($90 / 1.14623) = $13.88. Currentdollar change is then calculated by reflating the constandollar change using the average monthly price index: for June, $13.88 x 1.1935 = $16.57. Ch

24 ange in LIFO inventoriesBecause LIFO inv
ange in LIFO inventoriesBecause LIFO inventories increased from May to June, currentdollar change is equal to change in LIFO book value: for June, $2.00 (see appendix A). Constantdollar change is calculated by deflating the change in LIFO book value by the average monthly price index: for June, ($2.00 / 1.1935) = $1.68. urrentdollar change in inventories. Calculated as the sum of the currentdollar change in FIFO inventories and the currentdollar change in LIFO inventories: for June, $16.57 + $2.00 = $18.57. Constantdollar change in inventories. Calculated as the sum of the constant dollar change in FIFO inventories and the constandollar change in LIFO inventories: for June, $13.88 + $1.68 = $15.56. Step 5:Calculation of the Inventory Valuation djustment (IVA) hange in the book valueinventories. Calculated as the difference in the Census Bureau nonLIFO inventory levels:for June, $130 $110 = $20. . Calculated as the difference between currentdollar change in inventories and change in the book value of inventories: for June, $18.57 $20.00 = $1.43. (Note that because LIFO inventories increased during this period, the IVA for the LIFO portion of inventory change is $0, and the IVA for the FIFO portion is $16.57 $18.00 = Step 6: Calculation of currentdollar and constantdollar stocks Constantdollar stocks. Calculated by adding constantdollar change in inventories to the previous month’s constantdollar stock: assuming a constantdollar inventory level of $80 for May, the constantdollar stock of inventories for June is $80 + $15.56 = $95.56. ��CHAPTER HANGE IN RIVATE NVENTORIES 7 - 24 urrentdollar stocks. Calculated by reflating constantdollar stocks using end month prices: for June, $95.56 x 1.208 = $115.44. Note that while the difference between the constantdollar stocks for May and June ($15.56) is equal to constantdollar CIPI,the difference between the currentdollar stocks for May and June ($19.88) is not equal to currentdollar CIPI ($18.57). This is because the currentdollar stocks are valued at endperiod prices, while CIPI is valued using average prices for the period Because quarterly and monthly estimates in the NIPAs are expressed at annual rates, it is necessary to divide the CIPI estimates by 4 and by 12, respectively, to observ