/
Percent of all medical claim lines Percent of all medical claim lines

Percent of all medical claim lines - PDF document

heavin
heavin . @heavin
Follow
344 views
Uploaded On 2021-10-09

Percent of all medical claim lines - PPT Presentation

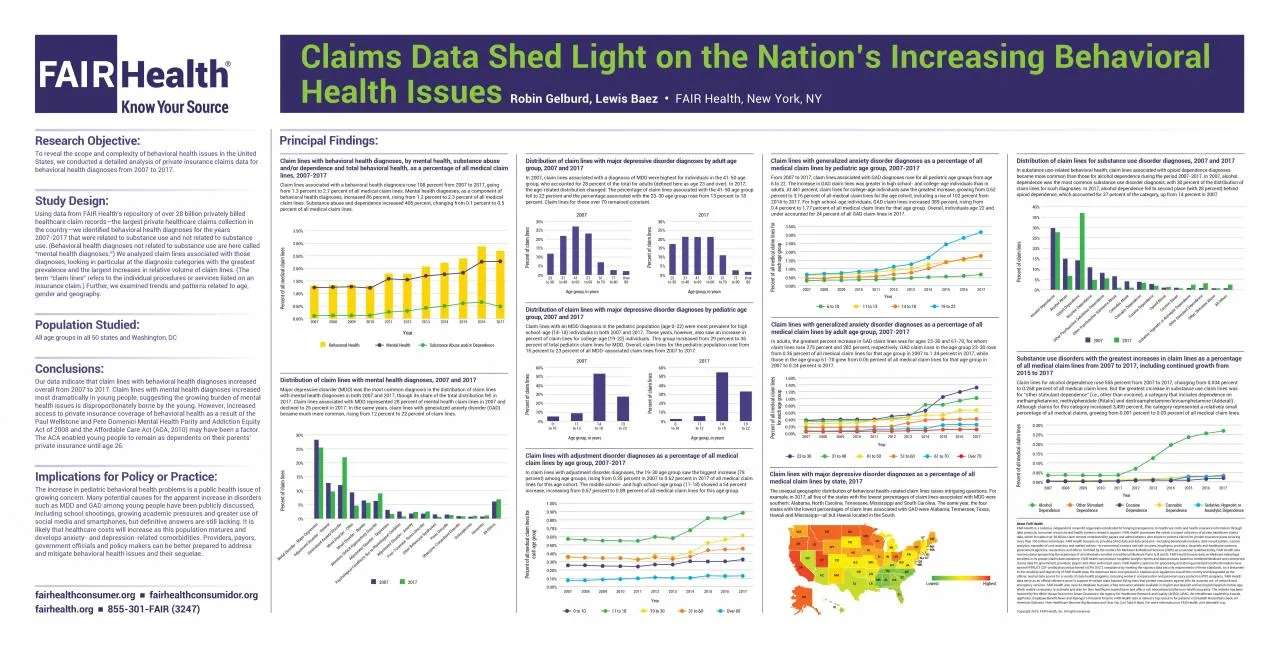
000050100150200250300350FAIR Health New York NYTo reveal the scope and complexity of behavioral health issues in the United States we conducted a detailed analysis of private insurance claims data for ID: 899229

percent claim health lines claim percent lines health age 2007 medical 2017 disorder data dependence diagnoses group fair behavioral

Share:

Link:

Embed:

Download Presentation from below link

Download Pdf The PPT/PDF document "Percent of all medical claim lines" is the property of its rightful owner. Permission is granted to download and print the materials on this web site for personal, non-commercial use only, and to display it on your personal computer provided you do not modify the materials and that you retain all copyright notices contained in the materials. By downloading content from our website, you accept the terms of this agreement.


Presentation Transcript

1 Percent of all medical claim lines 0.00%
Percent of all medical claim lines 0.00% 0.50% 1.00% 1.50% 2.00% 2.50% 3.00% 3.50% FAIR Health, New York, NYTo reveal the scope and complexity of behavioral health issues in the United States, we conducted a detailed analysis of private insurance claims data for behavioral health diagnoses from 2007 to 2017. Study Design: All age groups in all 50 states and Washington, DC Our data indicate that claim lines with behavioral health diagnoses increased overall from 2007 to 2017. Claim lines with mental health diagnoses increased The increase in pediatric behavioral health problems is a public health issue of growing concern. Many potential causes for the apparent increase in disorders Claim lines with adjustment disorder diagnoses as a percentage of all medical claim lines by age group, 2007-2017In claim lines with adjustment disorder diagnoses, the 19-30 age group saw the biggest increase (78 percent) among age groups, rising from 0.35 percent in 2007 to 0.62 percent in 2017 of all medical claim lines for this age cohort. The middle school- and high school-age group (11-18) showed a 54 percent increase, increasing from 0.57 percent to 0.89 percent of all medical claim lines for this age group. From 2007 to 2017, claim lines associated with GAD diagnoses rose for all pediatric age groups from age 6 to 22. The increase in GAD claim lines was greater in high school- and college-age individuals than in adults. At 441 percent, claim lines for college-age individuals saw the greatest increase, growing from 0.62 percent to 3.16 percent of all medical claim lines for the age cohort, including a rise of 102 percent from Claim lines with behavioral health diagnoses, by mental health, substance abuse and/or dependence and total behavioral health, as a percentage of all medical claim lines, 2007-2017Claim lines associated with a behavioral health diagnosis rose 108 percent from 2007 to 2017, going from 1.3 percent to 2.7 percent of all medical claim lines. Mental health diagnoses, as a component of behavioral health diagnoses, increased 86 percent, rising from 1.2 percent to 2.3 percent of all medical claim lines. Substance abuse and dependence increased 405 percent, changing from 0.1 percent to 0.5 percent of all medical claim lines. Distribution of claim lines with mental health diagnoses, 2007 and 2017Major depressive disorder (MDD) was the most common diagnosis in the distribution of claim lines with mental health diagnoses in both 2007 and 2017, though its share of the total distribution fell in 2017. Claim lines associated with MDD represented 28 percent of mental health claim lines in 2007 and declined to 26 percent in 2017. In the same years, claim lines with generalized anxiety disorder (GAD) became much more common, rising from 12 percent to 22 percent of claim lines. Percent of claim linesAge group, in years FAIR Health is a national, independent, nonprofit organization dedicated to bringing transparency to healthcare costs and health insurance information through data products, consumer resources and health systems research support. FAIR Health possesses the nation’s largest collection of private healthcare claims data, which includes over 28 billion claim records contributed by payors and administrators who insure or process claims for private insurance plans covering more than 150 million individuals. FAIR Health licenses its privately billed data and data products—including benchmark modules, data visualizations, custom analytics, episodes of care analytics and market indices—to commercial insurers and self-insurers, employers, providers, hospitals and healthcare systems, government agencies, researchers and others. Certified by the Centers for Medicare & Medicaid Services (CMS) as a national Qualified Entity, FAIR Health also receives data representing the experience of all individuals enrolled in traditional Medicare Parts A, B and D; FAIR Health houses data on Medicare Advantage enrollees in its private claims data repository. FAIR Health can produce insightful analytic reports and data products based on combined Medicare and commercialclaims data for government, providers, payors and other authorized users. FAIR Health’s systems for processing and storing protected health information have earned HITRUST CSF certification and achieved AICPA SOC 2 compliance by meeting the rigorous data security requirements of these standards. As a testament to the reliability and objectivity of FAIR Health data, the data have been incorporated in statutes and regulations around the country and designated as the official, neutral data source for a variety of state health programs, including workers’ compensation and personal injury protection (PIP) programs. FAIR Health data serve as an official reference point in support of certain state balance billing laws that protect consumers against bills for surprise out-of-network and emergency services. FAIR Health also uses its database to power a free consumer website available in English and Spanish and an English/Spanish mobile app, which enable consumers to estimate and plan for their healthcare expenditures and offer a rich educational platform on health insurance. The website has been fairhealthconsumer.org fairhealthconsumidor.orgfairhealth.org 855-301-FAIR (3247) Distribution of claim lines with major depressive disorder diagnoses by pediatric age group, 2007 and 2017 Claim lines with an MDD diagnosis in the pediatric population (age 0-22) were most prevalent for high school-age (14-18) individuals in both 2007 and 2017. These years, however, also saw an increase in percent of claim lines for college-age (19-22) individuals. This group increased from 29 percent to 36 percent of total pediatric claim lines for MDD. Overall, claim lines for the pediatric population rose from 15 percent to 23 percent of all MDD-associated claim lines from 2007 to 2017. Claim lines with generalized anxiety disorder diagnoses as a percentage of all medical claim lines by adult age group, 2007-2017In adults, the greatest percent increase in GAD claim lines was for ages 23-30 and 61-70, for whom claim lines rose 275 percent and 282 percent, respectively. GAD claim lines in the age group 23-30 rose from 0.36 percent of all medical claim lines for that age group in 2007 to 1.34 percent in 2017, while those in the age group 61-70 grew from 0.06 percent of all medical claim lines for that age group in 2007 to 0.24 percent in 2017. The unequal geographic distribution of behavioral health-related claim lines raises intriguing questions. For example, in 2017, all five of the states with the lowest percentages of claim lines associated with MDD were southern: Alabama, North Carolina, Tennessee, Mississippi and South Carolina. The same year, the four states with the lowest percentages of claim lines associated with GAD were Alabama, Tennessee, Texas, Hawaii and Mississippi—all but Hawaii located in the South. Substance use disorders with the greatest increases in claim lines as a percentage of all medical claim lines from 2007 to 2017, including continued growth from 2015 to 2017Claim lines for alcohol dependence rose 555 percent from 2007 to 2017, changing from 0.034 percent to 0.268 percent of all medical claim lines. But the greatest increase in substance use claim lines was for “other stimulant dependence” (i.e., other than cocaine), a category that includes dependence on methamphetamine, methylphenidate (Ritalin) and dextroamphetamine/levoamphetamine (Adderall). Although claims for this category increased 3,490 percent, the category represented a relatively small percentage of all medical claims, growing from 0.001 percent to 0.03 percent of all medical claim lines. In substance use-related behavioral health, claim lines associated with opioid dependence diagnoses became more common than those for alcohol dependence during the period 2007-2017. In 2007, alcohol dependence was the most common substance use disorder diagnosis, with 30 percent of the distribution of claim lines for such diagnoses. In 2017, alcohol dependence fell to second place (with 28 percent) behind opioid dependence, which accounted for 37 percent of the category, up from 14 percent in 2007. Percent of claim linesAge group, in years Percent of claim linesPercent of all medical claim lines forAge group, in years Percent of claim linesAge group, in years 0%10%20%30%40%50%60% 0.00% 0.10% 0.20% 0.30% 0.40% 0.50% 0.60% 0.70% 0.80% 0.90% 1.00%20072008200920102011201220132014201520162017Year 200920102011Behavioral Health 2007 2017 Mental HealthYear Substance Abuse and/or Dependence 0% 5% 10% 15% 20% 25% Percent of claim linesMood Disorder - Major Depression Adjustment Disorder - General Generalized Anxiety Disorder Mood Disorder - Other Mood Disorder - Bipolar Attention-Deficit Hyperactivity Disorder Adjustment Disorder - Depression Psychological Conditions due to Physiological Condition Adjustment Disorder - Anxiety Post-Traumatic Stress Disorder Other Behavioral Syndromes Panic Disorder Obsessive-Compulsive Disorder Schizophrenia Dementia All Others 0% 5% 10% 15% 20% 25% 30% 35% Percent of claim linesAlcohol DependenceOpioid DependenceNicotine DependenceOther Psychoactive Substance DependenceOther Psychoactive Substance AbuseCannabis DependenceCocaine DependenceSedative, Hypnotic or Anxiolytic DependenceOther Stimulant Dependence Percent of all medical claim linesfor each age groupPercent of all medical clalim lines for 0.00% 0.50% 1.00% 1.50% 2.00% 2.50% 3.00% 3.50% 20112012 23 to 30 31 to 40 41 to 50 51 to 60 61 to 70 Over 70 11 to 13 14 to 18 19 to 22 Percent of all medical clalim lines 0.00% 0.05% 0.10% 0.15% 0.20% 0.25% 0.30% 20072008200920102011201220132014201520162017 0 to 10 11 to 18 19 to 30 31 to 60 Over 60 0.60% 0.80% 1.00% 1.20% 1.40% 1.60% 0.00% 0.20% 0.40% 20092010201120162017 YearYear2007 2017 Dependence Other Stimulant Dependence Dependence Anxiolytic Dependence Highest NDNENMNVNY MARICTNJDEMD AK HI