/
Extremely Vulnerable Extremely Vulnerable

Extremely Vulnerable - PDF document

helene
helene . @helene
Follow
346 views
Uploaded On 2021-06-08

Extremely Vulnerable - PPT Presentation

RCP 85 Extremely Vulnerable RCP 45 
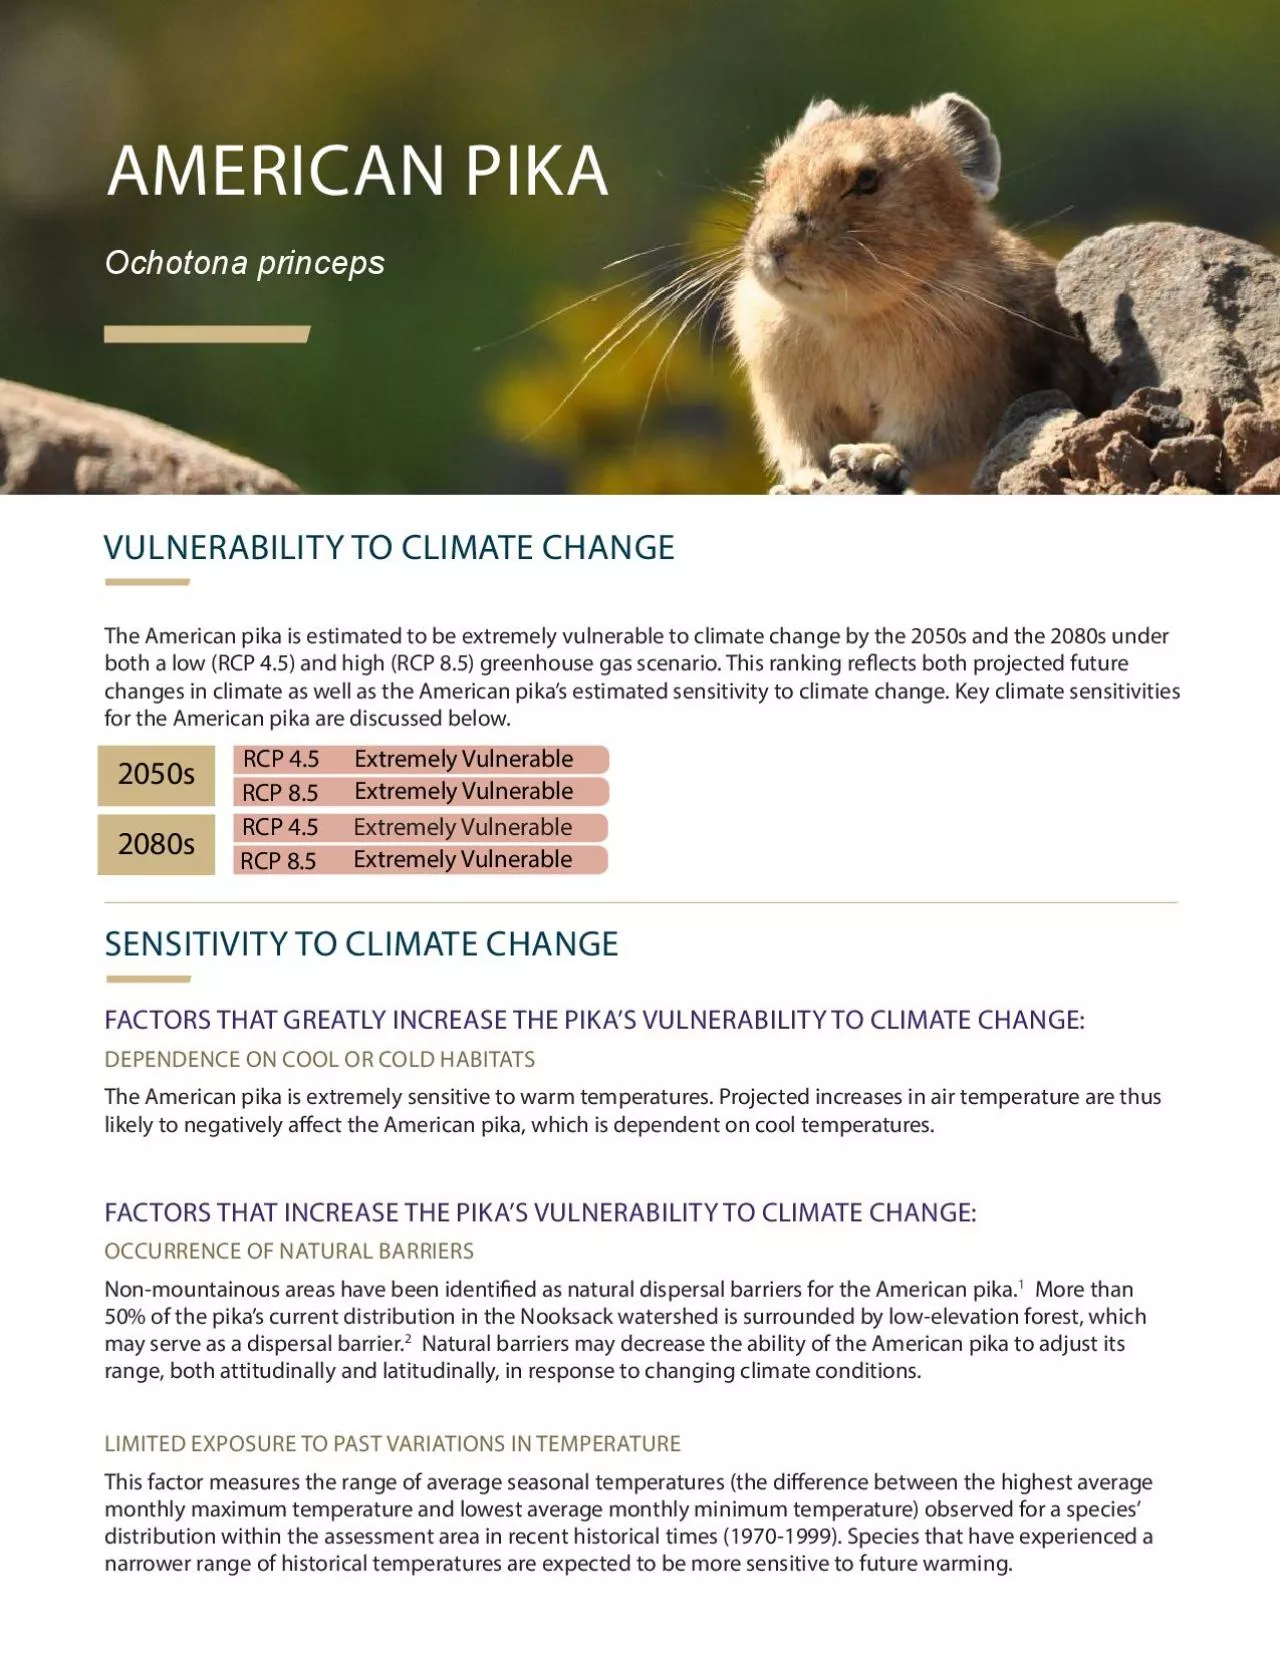
FACTORS THAT GREATLY INCREASE THE PIKAS VULNERABILITY TO CLIMATE CHANGE DEPENDENCE ON COOL OR COLD HABITATS The American pika is extremely sensitive to warm ID: 838028

change climate rcp vulnerable climate change vulnerable rcp vulnerability assessment extremely sensitivity range temperature average washington 2050s nooksack scenario

Share:

Link:

Embed:

Download Presentation from below link

Download Pdf The PPT/PDF document "Extremely Vulnerable" is the property of its rightful owner. Permission is granted to download and print the materials on this web site for personal, non-commercial use only, and to display it on your personal computer provided you do not modify the materials and that you retain all copyright notices contained in the materials. By downloading content from our website, you accept the terms of this agreement.


Presentation Transcript

1 Extremely Vulnerable RCP 8.5 Extremely
Extremely Vulnerable RCP 8.5 Extremely Vulnerable RCP 4.5 FACTORS THAT GREATLY INCREASE THE PIKA’S VULNERABILITY TO CLIMATE CHANGE: DEPENDENCE ON COOL OR COLD HABITATS The American pika is extremely sensitive to warm temperatures. Projected increases in air temperature are thus likely to negatively aect the American pika, which is dependent on cool temperatures. FACTORS THAT INCREASE THE PIKA’S VULNERABILITY TO CLIMATE CHANGE: OCCURRENCE OF NATURAL BARRIERS Non-mountainous areas have been identied as natural dispersal barriers for the American pika. 1 More than 50% of the pika’s current distribution in the Nooksack watershed is surrounded by low-elevation forest, which may serve as a dispersal barrier. 2 Natural barriers may decrease the ability of the American pika to adjust its range, both attitudinally and latitudinally, in response to changing climate conditions. LIMITED EXPOSURE TO PAST VARIATIONS IN TEMPERATURE This factor measures the range of average seasonal temperatures (the dierence between the highest average monthly maximum temperature and lowest average monthly minimum temperature) observed for a species’ distribution within the assessment area in recent historical times (1970-1999). Species that have experienced a narrower range of historical temperatures are expected to be more sensitive to future warming. AMERICAN PIKA SENSITIVITY TO CLIMATE CHANGE Extremely Vulnerable RCP 8.5 Extremely Vulnerable RCP 4.5 VULNERABILITY TO CLIMATE CHANGE The American pika is estimated to be extremely vulnerable to climate change by the 2050s and the 2080s under both a low (RCP 4.5) and high (RCP 8.5) greenhouse gas scenario. This ranking reects both projected future changes in c

2 limate as well as the American pika’s
limate as well as the American pika’s estimated sensitivity to climate change. Key climate sensitivities for the American pika are discussed below. Ochotona princeps 2050s 2080s FACTORS THAT SOMEWHAT THE PIKA’S VULNERABILITY TO CLIMATE CHANGE:LIMITED DISPERSAL ABILITIESThe American pika has small home ranges (reported home ranges span 0.3 - 0.5 hectares), and are not long-distance migrants. The American pika’s poor dispersal ability decreases the likelihood that the species will be able to adjust its range to keep pace with shifting climate conditions.DEPENDENCE ON SNOW Extended snow cover (e.g., longer than two weeks) may increase the likelihood of pika occupancy within otherwise suitable habitat. Projected declines in winter snowpack may thus negatively aect American pika habitat.DEPENDENCE ON RARE LANDSCAPE FEATURES The American pika exclusively inhabits rocky talus slopes between the talus-meadow interface. Its association with a specic geologic feature is expected to limit the pika’s ability to adapt to habitat loss from climate change. LIMITED GENETIC DIVERSITYThe American pika has been observed to have low levels of genetic diversity in populations at the northern end of its range. Species with low levels of genetic variation are expected to be less able to adapt to changing climatic conditions. FOR MORE INFORMATION This fact sheet is a product of the Nooksack Indian Tribe Natural Resources Climate Change Vulnerability Assessment. For more information on the American pika’s sensitivity and vulnerability to climate change or to nd out more about the overall assessment results please reference the report or contact the University of Washington Climate Impacts Group (https://cig.uw.edu; cig@uw.e

3 du). Morgan, H., and M. Krosby. 2017. No
du). Morgan, H., and M. Krosby. 2017. Nooksack Indian Tribe Natural Resources Climate Change Vulnerability Assessment. Climate Impacts Group, University of Washington.CITATIONS [1] Meredith, S.J. 2002. The impact of habitat spatial structure on pika (Ochotona princeps) dispersal dynamics. M.S. thesis, University of Nevada, Reno. 62 pages..en-US&#x/Lan;&#xg 00;&#x/Lan;&#xg 00; Nooksack Tribal sta; personal communication.tion.en-US&#x/Lan;&#xg 00;&#x/Lan;&#xg 00; U.S. Fish and Wildlife Service. 2010. Endangered and Threatened Wildlife and Plants; 12-month Finding on a Petition to List the American Pika as Threatened or Endangered. 75 FR 67925. Pg. 67925-67944.. 67925-67944.en-US&#x/Lan;&#xg 00;&#x/Lan;&#xg 00;Mauger, G.S., J.H. Casola, H.A. Morgan, R.L. Strauch, B. Jones, B. Curry, T.M. Busch Isaksen, L.Whitely Binder, M.B. Krosby, and A.K. Snover. 2015. State of Knowledge: Climate Change in Puget Sound. Climate Impacts Group, University of Washington, Seattle..en-US&#x/Lan;&#xg 00;&#x/Lan;&#xg 00; NatureServe Explorer. American pika (Ochotona princeps).IMAGE CREDIT Front Page: American pika by Shanthanu Bhardwaj, used under CC BY-NC-ND 2.0Back Page: American pika by Robin Horn, used under CC BY-NC-ND 2.0 Extremely Vulnerable RCP 8.5 Moderately Vulnerable RCP 4.5 FACTORS THAT INCREASE THE DEER’S VULNERABILITY TO CLIMATE CHANGE: LIMITED EXPOSURE TO PAST VARIATIONS IN TEMPERATURE This factor measures the range of average seasonal temperatures (the dierence between the highest average monthly maximum temperature and lowest average monthly minimum temperature) observed for a species’ distribution within the assessment area in recent historical times (1970-1999). Species that have experienced a narrower range o

4 f historical temperatures are expected t
f historical temperatures are expected to be more sensitive to future warming. FACTORS THAT SOMEWHAT INCREASE THE DEER’S VULNERABILITY TO CLIMATE CHANGE: OCCURRENCE OF NATURAL BARRIERS While black-tailed deer are good dispersers, rugged mountain terrain can act as barriers to movement. 1 In addition, postⴞre deadfall accumulation can impede dispersal. 2 Natural barriers may decrease the ability of the black-tailed deer to adjust its range in response to changing climate conditions. BLACKTAILED DEER SENSITIVITY TO CLIMATE CHANGE Extremely Vulnerable RCP 8.5 Extremely Vulnerable RCP 4.5 VULNERABILITY TO CLIMATE CHANGE The black-tailed deer is estimated to be moderately vulnerable to climate change by the 2050s under a low greenhouse gas scenario and extremely vulnerable by the 2050s under a high scenario. The black-tailed deer is estimated to be extremely vulnerable to climate change by the 2080s under both a low (RCP 4.5) and high (RCP 8.5) greenhouse gas scenario (RCP 8.5). This ranking reects both projected future changes in climate as well as the black-tailed deer’s estimated sensitivity to climate change. Key climate sensitivities for the black-tailed deer are discussed below. Odocoileus hemionus 2050s 2080s OCCURRENCE OF MANMADE BARRIERS Fences are a major barrier to black-tailed deer movement in the western U.S. 3 Urban, suburban, or rural housing developments can also obstruct black- tailed deer movement. These dispersal barriers may limit the black-tailed deer’s ability to adjust its range response to changing climate conditions. SENSITIVITY TO DISEASE There are many bacterial diseases and parasites that negatively aect black- tailed deer, some of which may become more

5 prevalent or severe under climate chang
prevalent or severe under climate change. For example, increasing incidence of drought and warming temperatures may benet biting gnat populations, which transmit blue tongue virus to mule deer. Sensitivity to pathogens may thus increase black- tailed deer’s vulnerability to climate change. SENSITIVITY TO COMPETITION Black-tailed deer habitat use may be indirectly aected by other wildlife species that may benet from climate change. For example, black-tailed deer habitat selection has been shown to be strongly inuenced by avoidance of areas inhabited by elk. Elk can eat a greater variety of forage than black- tailed deer, which may give elk a competitive advantage under climate change. FOR MORE INFORMATION This fact sheet is a product of the Nooksack Indian Tribe Natural Resources Climate Change Vulnerability Assessment. For more information on the black-tailed deer’s sensitivity and vulnerability to climate change or to nd out more about the overall assessment results please reference the report or contact the University of Washington Climate Impacts Group (https:// cig.uw.edu; cig@uw.edu). Morgan, H., and M. Krosby. 2017. Nooksack Indian Tribe Natural Resources Climate Change Vulnerability Assessment. Climate Impacts Group, University of Washington. CITATIONS [1] Climate Change Sensitivity Database. Black-tailed deer (Odocoileus hemionus). [2] Innes, R. J. 2013. Odocoileus hemionus. In: Fire Eects Information System, [Online]. U.S. Department of Agriculture, Forest Service, Rocky Mountain Research Station, Fire Sciences Laboratory (Producer). Available: http://www.fs.fed.us/database/feis/animals/mammal/odhe/ all.html [2017, November 12]. [3] Wakeling, B.F., J.W. Gagnon, D.

6 D. Olson, D.W. Lutz, T.W. Keegan, J.M. S
D. Olson, D.W. Lutz, T.W. Keegan, J.M. Shannon, A. Holland, A. Lindbloom, and C. Schroeder. 2015. Mule Deer and Movement Barriers. Mule Deer Working Group, Western Association of Fish and Wildlife Agencies, U.S.A. IMAGE CREDIT Front Page: Black-tailed deer by Andrew DuBois, used under CC BY-NC-ND 2.0 Back Page: Black-tailed deer by USFWS Pacic Region, used under CC BY-NC-ND 2.0 Highly Vulnerable RCP 8.5 Moderately Vulnerable RCP 4.5 FACTORS THAT INCREASE THE HERON’S VULNERABILITY TO CLIMATE CHANGE: LIMITED EXPOSURE TO PAST VARIATIONS IN TEMPERATURE This factor measures the range of average seasonal temperatures (the dierence between the highest average monthly maximum temperature and lowest average monthly minimum temperature) observed for a species’ distribution within the assessment area in recent historical times (1970-1999). Species that have experienced a narrower range of historical temperatures are expected to be more sensitive to future warming. CHANGES IN STREAMFLOW AND WATER AVAILABILITY The great blue heron inhabits coastal lowlands, wetlands, marshes, wet meadows, vernal pools, stream channels (natural, irrigation, and drainage channels), and springs. 1, 2 Each of these habitats may be aected by projected increases in winter ood risk and declines in summer low ows. The great blue heron is also expected to be negatively aected if wetlands dry out in summer months, diminishing its prey base. 1 GREAT BLUE HERON SENSITIVITY TO CLIMATE CHANGE Highly Vulnerable RCP 8.5 Highly Vulnerable RCP 4.5 VULNERABILITY TO CLIMATE CHANGE The great blue heron is estimated to be moderately vulnerable to climate change by the 2050s under a low (RCP 4.5) greenhouse gas scenario and

7 highly vulnerable by the 2050s under a
highly vulnerable by the 2050s under a high (RCP 8.5) greenhouse gas scenario. The heron is estimated to be highly vulnerable to climate change by the 2080s under both a low and high greenhouse gas scenario. This ranking reects both projected future changes in climate as well as the great blue heron’s estimated sensitivity to climate change. Key climate sensitivities for the great blue heron are discussed below. Ardea herodias 2050s 2080s FOR MORE INFORMATION This fact sheet is a product of the Nooksack Indian Tribe Natural Resources Climate Change Vulnerability Assessment. For more information on the great blue heron’s sensitivity and vulnerability to climate change or to nd out more about the overall assessment results please reference the report or contact the University of Washington Climate Impacts Group (https:// cig.uw.edu; cig@uw.edu). Morgan, H., and M. Krosby. 2017. Nooksack Indian Tribe Natural Resources Climate Change Vulnerability Assessment. Climate Impacts Group, University of Washington. CITATIONS [1] Nooksack Tribal sta; personal communication. [2] Climate Change Sensitivity Database. Great blue heron (Ardea herodias). IMAGE CREDIT Front Page: Great blue heron by Christa R., used under CC BY-NC-ND 2.0 Back Page: Great blue heron by NOAA Fisheries West Coast, used under CC BY-NC- ND 2.0 Extremely Vulnerable RCP 8.5 Extremely Vulnerable RCP 4.5 FACTORS THAT GREATLY INCREASE THE GOAT’S VULNERABILITY TO CLIMATE CHANGE: DEPENDENCE ON COOL OR COLD HABITATS The mountain goat is adapted to cold alpine and subalpine habitats, which are sensitive to climate change. FACTORS THAT INCREASE THE GOAT’S VULNERABILITY TO CLIMATE CHANGE: LIMITED GENETIC DIVERSITY Low genetic varia

8 tion has been observed in mountain goat
tion has been observed in mountain goat populations inhabiting the Cascade Range in Washington. 1 Species with low levels of genetic variation are expected to be less able to adapt to changing climate conditions than populations with average to high levels of genetic diversity. FACTORS THAT SOMEWHAT INCREASE THE GOAT’S VULNERABILITY TO CLIMATE CHANGE: OCCURRENCE OF NATURAL BARRIERS The mountain goat is a capable disperser but very high and very low elevations as well as bodies of water serve as barriers to movement. 2 Natural barriers may decrease the ability of the mountain goat to adjust its range in response to changing climate conditions. MOUNTAIN GOAT SENSITIVITY TO CLIMATE CHANGE Extremely Vulnerable RCP 8.5 Extremely Vulnerable RCP 4.5 VULNERABILITY TO CLIMATE CHANGE The mountain goat is estimated to be extremely vulnerable to climate change by the 2050s and the 2080s under both a low (RCP 4.5) and high (RCP 8.5) greenhouse gas scenario. This ranking reects both projected future changes in climate as well as the mountain goat’s estimated sensitivity to climate change. Key climate sensitivities for the mountain goat are discussed below. Oreamnos americanus 2050s 2080s FOR MORE INFORMATION This fact sheet is a product of the Nooksack Indian Tribe Natural Resources Climate Change Vulnerability Assessment. For more information on the mountain goat’s sensitivity and vulnerability to climate change or to nd out more about the overall assessment results please reference the report or contact the University of Washington Climate Impacts Group (https:// cig.uw.edu; cig@uw.edu). Morgan, H., and M. Krosby. 2017. Nooksack Indian Tribe Natural Resources Climate Change Vulnerability Assessment.

9 Climate Impacts Group, University of Wa
Climate Impacts Group, University of Washington. CITATIONS [1] Innes, Robin J. 2011. Oreamnos americanus. In: Fire Eects Information System, [Online]. U.S. Department of Agriculture, Forest Service, Rocky Mountain Research Station, Fire Sciences Laboratory (Producer). Available: http://www.fs.fed.us/database/feis/ [2017, November 12]. [2] Shirk, A. J. 2009. Mountain goat genetic structure, molecular diversity, and gene ow in the Cascade Range, Washington. M.S. Thesis, Western Washington University, Bellingham, WA. [3] ClimateWashington Wildlife Habitat Connectivity Working Group. 2010. Washington Connected Landscapes Project: Statewide Analysis. Washington Departments of Fish and Wildlife, and Transportation, Olympia, WA. www.waconnected.org. [4] Nooksack Tribal sta; personal communication. IMAGE CREDIT Front Page: Mountain goat by Tjex2, used under CC BY-NC-ND 2.0 Back Page: Mountain goat by Richard Deakins, used under CC BY-NC-ND 2.0 OCCURRENCE OF MANMADE BARRIERS While highways, urban areas, and agricultural elds have been identied as anthropogenic barriers to mountain goat dispersal, 2 such barriers are rare in and near mountain goat habitat within the Nooksack watershed. Additionally, the majority of mountain goat habitat in the Nooksack watershed is designated as wilderness, and is therefore unlikely to see future road and/or trail construction. 3 However, even at low densities, the presence of such barriers may limit the ability of the mountain goat to adjust its range in response to changing climate conditions. LIMITED EXPOSURE TO PAST VARIATIONS IN TEMPERATURE This factor measures the range of average seasonal temperatures (the 摩�erence betwe

10 en the highest average monthly maximum t
en the highest average monthly maximum temperature and lowest average monthly minimum temperature) observed for a species’ distribution within the assessment area in recent historical times (1970-1999). Species that have experienced a narrower range of historical temperatures are expected to be more sensitive to future warming. changes in temperature. DEPENDENCE ON RARE LANDSCAPE FEATURES The mountain goat inhabits open subalpine and alpine areas with close proximity to escape terrain (e.g., steep, rocky ledges and clis). 1 Because mountain goats are associated with steep rocky outcroppings and clis, they are less likely to be able to adapt to habitat loss from climate change, compared to species that are not dependent on uncommon geologic features. Moderately Vulnerable RCP 8.5 Less Vulnerable RCP 4.5 FACTORS THAT INCREASE THE MOUNTAIN LION’S VULNERABILITY TO CLIMATE CHANGE: LIMITED EXPOSURE TO PAST VARIATIONS IN TEMPERATURE This factor measures the range of average seasonal temperatures (the dierence between the highest average monthly maximum temperature and lowest average monthly minimum temperature) observed for a species’ distribution within the assessment area in recent historical times (1970-1999). Species that have experienced a narrower range of historical temperatures are expected to be more sensitive to future warming. changes in temperature. FACTORS THAT SOMEWHAT INCREASE THE MOUNTAIN LION’S VULNERABILITY TO CLIMATE CHANGE: OCCURRENCE OF MANMADE BARRIERS Major highways as well as urban, agricultural, and industrial areas have all been identied as anthropogenic barriers to mountain lion dispersal. 1 These barriers may limit the ability of the mountain lion t

11 o adjust its range in response to chang
o adjust its range in response to changing climate conditions. MOUNTAIN LION SENSITIVITY TO CLIMATE CHANGE Moderately Vulnerable RCP 8.5 Moderately Vulnerable RCP 4.5 VULNERABILITY TO CLIMATE CHANGE The mountain lion is estimated to be less vulnerable to climate change by the 2050s under a low (RCP 4.5) greenhouse gas scenario and moderately vulnerable by the 2050s under a high (RCP 8.5) greenhouse gas scenario. The mountain lion is estimated to be moderately vulnerable to climate change by the 2080s under both a low and high greenhouse gas scenario. This ranking reects both projected future changes in climate as well as the mountain lion’s estimated sensitivity to climate change. Key climate sensitivities for the mountain lion are discussed below. Puma concolor 2050s 2080s FOR MORE INFORMATION This fact sheet is a product of the Nooksack Indian Tribe Natural Resources Climate Change Vulnerability Assessment. For more information on the mountain lion’s sensitivity and vulnerability to climate change or to nd out more about the overall assessment results please reference the report or contact the University of Washington Climate Impacts Group (https:// cig.uw.edu; cig@uw.edu). Morgan, H., and M. Krosby. 2017. Nooksack Indian Tribe Natural Resources Climate Change Vulnerability Assessment. Climate Impacts Group, University of Washington. CITATIONS [1] Climate Change Sensitivity Database. Mountain lion (Puma concolor). IMAGE CREDIT Front Page: Mountain lion by Tjex2, used under CC BY-NC-ND 2.0 Back Page: Mountain lion by Tambako, used under CC BY-NC-ND 2.0 Extremely Vulnerable RCP 8.5 Highly Vulnerable RCP 4.5 FACTORS THAT INCREASE THE SWAN’S VULNERABILITY TO CLIMATE CHANGE: LIMITED E

12 XPOSURE TO PAST VARIATIONS IN TEMPERATUR
XPOSURE TO PAST VARIATIONS IN TEMPERATURE This factor measures the range of average seasonal temperatures (the dierence between the highest average monthly maximum temperature and lowest average monthly minimum temperature) observed for a species’ distribution within the assessment area in recent historical times (1970-1999). Species that have experienced a narrower range of historical temperatures are expected to be more sensitive to future warming. CHANGES IN STREAMFLOW AND WATER AVAILABILITY Juvenile swan survival is tightly linked with stable water levels at nesting sites. 1 Projected increases in winter ood risk in western Washington 2 may negatively aect nesting habitat and edgling survival. TRUMPETER SWAN SENSITIVITY TO CLIMATE CHANGE Extremely Vulnerable RCP 8.5 Extremely Vulnerable RCP 4.5 VULNERABILITY TO CLIMATE CHANGE The trumpeter swan is estimated to be highly vulnerable to climate change by the 2050s under a low (RCP 4.5) greenhouse gas scenario and extremely vulnerable by the 2050s under a high (RCP 8.5) greenhouse gas scenario. The trumpeter swan is estimated to be extremely vulnerable to climate change by the 2080s under both a low and high greenhouse gas scenario. This ranking reects both projected future changes in climate as well as the trumpeter swan’s estimated sensitivity to climate change. Key climate sensitivities for the trumpeter swan are discussed below. Cygnus buccinators 2050s 2080s FOR MORE INFORMATION This fact sheet is a product of the Nooksack Indian Tribe Natural Resources Climate Change Vulnerability Assessment. For more information on the trumpeter swan’s sensitivity and vulnerability to climate change or to nd out more about the ove

13 rall assessment results please referenc
rall assessment results please reference the report or contact the University of Washington Climate Impacts Group (https:// cig.uw.edu; cig@uw.edu). Morgan, H., and M. Krosby. 2017. Nooksack Indian Tribe Natural Resources Climate Change Vulnerability Assessment. Climate Impacts Group, University of Washington. CITATIONS [1] Tesky, Julie L. 1993. Cygnus buccinator. In: Fire Eects Information System, [Online]. U.S. Department of Agriculture, Forest Service, Rocky Mountain Research Station, Fire Sciences Laboratory (Producer). [2] Mauger, G.S., J.H. Casola, H.A. Morgan, R.L. Strauch, B. Jones, B. Curry, T.M. Busch Isaksen, L. Whitely Binder, M.B. Krosby, and A.K. Snover. 2015. State of Knowledge: Climate Change in Puget Sound. Climate Impacts Group, University of Washington, Seattle. IMAGE CREDIT Front Page: Trumpeter swan by Michael Janke, used under CC BY-NC-ND 2.0 Back Page: Trumpeter swan by USFWS, used under CC BY-NC-ND 2.0 Extremely Vulnerable RCP 8.5 Highly Vulnerable RCP 4.5 FACTORS THAT INCREASE THE ELK’S VULNERABILITY TO CLIMATE CHANGE: LIMITED EXPOSURE TO PAST VARIATIONS IN TEMPERATURE This factor measures the range of average seasonal temperatures (the dierence between the highest average monthly maximum temperature and lowest average monthly minimum temperature) observed for a species’ distribution within the assessment area in recent historical times (1970-1999). Species that have experienced a narrower range of historical temperatures are expected to be more sensitive to future warming. OCCURRENCE OF MANMADE BARRIERS Human disturbances, including road construction and logging, can serve as anthropogenic barriers to elk dispersal. 1 A signicant percentage of elk habit

14 at in the Nooksack watershed is located
at in the Nooksack watershed is located in active forest areas. 2 These barriers may limit the ability of the elk to adjust its range in response to changing climate conditions. ELK SENSITIVITY TO CLIMATE CHANGE Extremely Vulnerable RCP 8.5 Extremely Vulnerable RCP 4.5 VULNERABILITY TO CLIMATE CHANGE The elk is estimated to be highly vulnerable to climate change by the 2050s under a low (RCP 4.5) greenhouse gas scenario and extremely vulnerable by the 2050s under a high (RCP 8.5) greenhouse gas scenario. The elk is estimated to be extremely vulnerable to climate change by the 2080s under both a low and high greenhouse gas scenario. This ranking reects both projected future changes in climate as well as the elk’s estimated sensitivity to climate change. Key climate sensitivities for the elk are discussed below. Cervus canadensis 2050s 2080s FOR MORE INFORMATION This fact sheet is a product of the Nooksack Indian Tribe Natural Resources Climate Change Vulnerability Assessment. For more information on the elk’s sensitivity and vulnerability to climate change or to nd out more about the overall assessment results please reference the report or contact the University of Washington Climate Impacts Group (https://cig.uw.edu; cig@uw.edu). Morgan, H., and M. Krosby. 2017. Nooksack Indian Tribe Natural Resources Climate Change Vulnerability Assessment. Climate Impacts Group, University of Washington. CITATIONS [1] Innes, Robin J. 2011. Cervus elaphus. In: Fire Eects Information System, [Online]. U.S. Department of Agriculture, Forest Service, Rocky Mountain Research Station, Fire Sciences Laboratory (Producer). Available: http://www.fs.fed.us/database/feis/ [2017, November 12]. [2] Nooksack Tr

15 ibal sta; personal communication. I
ibal sta; personal communication. IMAGE CREDIT Front Page: Elk by Andrew E. Russell, used under CC BY-NC-ND 2.0 Back Page: Elk by Tupulak, used under CC BY-NC-ND 2.0 Extremely Vulnerable RCP 8.5 Moderately Vulnerable RCP 4.5 FACTORS THAT INCREASE THE BLACK BEAR’S VULNERABILITY TO CLIMATE CHANGE: LIMITED EXPOSURE TO PAST VARIATIONS IN TEMPERATURE This factor measures the range of average seasonal temperatures (the dierence between the highest average monthly maximum temperature and lowest average monthly minimum temperature) observed for a species’ distribution within the assessment area in recent historical times (1970-1999). Species that have experienced a narrower range of historical temperatures are expected to be more sensitive to future warming. OCCURRENCE OF MANMADE BARRIERS Highways, roads, and urban areas have been identied as anthropogenic barriers to black bear dispersal. 1,2 Human population growth and expanded development will likely increase the number of anthropogenic barriers encountered by black bears. These barriers may limit the ability of the black bear to adjust its range in response to changing climate conditions. BLACK BEAR SENSITIVITY TO CLIMATE CHANGE Extremely Vulnerable RCP 8.5 Extremely Vulnerable RCP 4.5 VULNERABILITY TO CLIMATE CHANGE The black bear is estimated to be moderately vulnerable to climate change by the 2050s under a low (RCP 4.5) greenhouse gas scenario and extremely vulnerable by the 2050s under a high (RCP 8.5) greenhouse gas scenario. The black bear is estimated to be extremely vulnerable to climate change by the 2080s under both a low and high greenhouse gas scenario. This ranking reects both projected future changes in climate as

16 well as the black bear’s estimated s
well as the black bear’s estimated sensitivity to climate change. Key climate sensitivities for the black bear are discussed below. Cervus canadensis 2050s 2080s FOR MORE INFORMATION This fact sheet is a product of the Nooksack Indian Tribe Natural Resources Climate Change Vulnerability Assessment. For more information on the black bear’s sensitivity and vulnerability to climate change or to nd out more about the overall assessment results please reference the report or contact the University of Washington Climate Impacts Group (https://cig.uw.edu; cig@uw.edu). Morgan, H., and M. Krosby. 2017. Nooksack Indian Tribe Natural Resources Climate Change Vulnerability Assessment. Climate Impacts Group, University of Washington. CITATIONS [1] I Washington Wildlife Habitat Connectivity Working Group. 2010. Washington Connected Landscapes Project: Statewide Analysis. Washington Departments of Fish and Wildlife, and Transportation, Olympia, WA. www.waconnected.org. [2] Ulev, Elena. 2007. Ursus americanus. In: Fire Eects Information System, [Online]. U.S. Department of Agriculture, Forest Service, Rocky Mountain Research Station, Fire Sciences Laboratory (Producer). Available: http://www.fs.fed.us/database/feis/animals/mammal/uram/ all.html [2017, November 12]. IMAGE CREDIT Front Page: Black bear by Jitze Couperus, used under CC BY-NC-ND 2.0 Back Page: Black bear approaching by Eric Kilby, used under CC BY-NC-ND 2.0 FACTORS THAT SOMEWHAT INCREASE THE BLACK BEAR’S VULNERABILITY TO CLIMATE CHANGE: OCCURRENCE OF NATURAL BARRIERS While black bears are capable dispersers, dry low-elevation habitat types and rivers may act as natural barriers to bear dispersal. 1 Natural barriers may decrease the abili

17 ty of the black bear to adjust its range
ty of the black bear to adjust its range in response to changing climate conditions. Extremely Vulnerable RCP 8.5 Moderately Vulnerable RCP 4.5 FACTORS THAT INCREASE THE BUFFLEHEAD’S VULNERABILITY TO CLIMATE CHANGE: LIMITED EXPOSURE TO PAST VARIATIONS IN TEMPERATURE This factor measures the range of average seasonal temperatures (the dierence between the highest average monthly maximum temperature and lowest average monthly minimum temperature) observed for a species’ distribution within the assessment area in recent historical times (1970-1999). Species that have experienced a narrower range of historical temperatures are expected to be more sensitive to future warming. DEPENDENCE ON OTHER SPECIES FOR HABITAT The buehead nests exclusively in tree cavities constructed by the northern icker, and less frequently by the pileated woodpecker. 1 Species that rely on a small number of species for habitat or nesting sites are likely to be more vulnerable to climate change than species that have more generalized habitat requirements. SENSITIVITY TO CLIMATE CHANGE Extremely Vulnerable RCP 8.5 Extremely Vulnerable RCP 4.5 VULNERABILITY TO CLIMATE CHANGE The buehead is estimated to be moderately vulnerable to climate change by the 2050s under a low (RCP 4.5) greenhouse gas scenario and extremely vulnerable by the 2050s under a high (RCP 8.5) greenhouse gas scenario. The buehead is estimated to be extremely vulnerable to climate change by the 2080s under both a low and high greenhouse gas scenario. This ranking reects both projected future changes in climate as well as the buehead’s estimated sensitivity to climate change. Key climate sensitivities for the buehead are discus

18 sed below. 2050s 2080s BUFFLEHEAD Buce
sed below. 2050s 2080s BUFFLEHEAD Bucephala albeola FOR MORE INFORMATION This fact sheet is a product of the Nooksack Indian Tribe Natural Resources Climate Change Vulnerability Assessment. For more information on the buehead’s sensitivity and vulnerability to climate change or to nd out more about the overall assessment results please reference the report or contact the University of Washington Climate Impacts Group (https://cig.uw.edu; cig@uw.edu). Morgan, H., and M. Krosby. 2017. Nooksack Indian Tribe Natural Resources Climate Change Vulnerability Assessment. Climate Impacts Group, University of Washington. CITATIONS [1] Gauthier, Gilles. 2014. Buehead (Bucephala albeola), version 2.0. In: The Birds of North America (P. G. Rodewald, editor). Cornell Lab of Ornithology, Ithaca, New York, USA. https:// doi.org/10.2173/bna.67 [2] Mauger, G.S., J.H. Casola, H.A. Morgan, R.L. Strauch, B. Jones, B. Curry, T.M. Busch Isaksen, L. Whitely Binder, M.B. Krosby, and A.K. Snover. 2015. State of Knowledge: Climate Change in Puget Sound. Climate Impacts Group, University of Washington, Seattle. IMAGE CREDIT Front Page: Buehead duck by Rennett Stowe, used under CC BY-NC-ND 2.0 Back Page: Buehead by K Schneider, used under CC BY-NC-ND 2.0 FACTORS THAT SOMEWHAT INCREASE THE BUFFLEHEAD’S VULNERABILITY TO CLIMATE CHANGE: SEA LEVEL RISE Washington is part of the buehead’s winter range, which consists primarily of saltwater areas (beaches, estuaries, and harbors). 1 Buehead within the Nooksack watershed are thus likely to be aected by sea level rise CHANGES IN STREAMFLOW AND WATER AVAILABILITY The buehead is dependent on small permanent ponds in the breeding range. 1 Th

19 ese habitats may be sensitive to project
ese habitats may be sensitive to projected increases winter ood risk and declining summer lowⴝows. 2 Extremely Vulnerable RCP 8.5 Extremely Vulnerable RCP 4.5 FACTORS THAT INCREASE THE ALASKA CEDAR’S VULNERABILITY TO CLIMATE CHANGE: LIMITED EXPOSURE TO PAST VARIATIONS IN TEMPERATURE This factor measures the range of average seasonal temperatures (the dierence between the highest average monthly maximum temperature and lowest average monthly minimum temperature) observed for a species’ distribution within the assessment area in recent historical times (1970-1999). Species that have experienced a narrower range of historical temperatures are expected to be more sensitive to future warming. DEPENDENCE ON SNOW Alaska cedar, also referred to as yellow-cedar, has experienced wide spread decline in Alaska and British Columbia. This widespread decline has not been linked with a biotic fungi, nematode, insect, or virus; and is therefore thought to be associated with an abiotic process. Specically, declining snowpack is thought to expose the roots of the Alaska cedar to freezing damage during the winter months. Therefore, declining snowpack may negatively aect Alaska cedar. 1 FACTORS THAT SOMEWHAT INCREASE THE ALASKA CEDAR’S VULNERABILITY TO CLIMATE CHANGE: OCCURRENCE OF MANMADE BARRIERS The region north of the Nooksack watershed is largely bordered by developed agricultural land, which may limit to ability of the Alaska cedar to disperse into cool forests north of the Nooksack watershed. SENSITIVITY TO CLIMATE CHANGE Extremely Vulnerable RCP 8.5 Extremely Vulnerable RCP 4.5 VULNERABILITY TO CLIMATE CHANGE The Alaska cedar is estimated to be extremely vulnerable to climate change

20 by the 2050s and the 2080s under both a
by the 2050s and the 2080s under both a low (RCP 4.5) and high (RCP 8.5) greenhouse gas scenario. This ranking reects both projected future changes in climate as well as the Alaska cedar’s estimated sensitivity to climate change. Key climate sensitivities for the Alaska cedar are discussed below. 2050s 2080s ALASKA CEDAR Callitropsis nootkatensis FOR MORE INFORMATION This fact sheet is a product of the Nooksack Indian Tribe Natural Resources Climate Change Vulnerability Assessment. For more information on the Alaska cedar’s sensitivity and vulnerability to climate change or to nd out more about the overall assessment results please reference the report or contact the University of Washington Climate Impacts Group (https:// cig.uw.edu; cig@uw.edu). Morgan, H., and M. Krosby. 2017. Nooksack Indian Tribe Natural Resources Climate Change Vulnerability Assessment. Climate Impacts Group, University of Washington. CITATIONS [1] Schaberg, P.G., P.E. Hennon, D.V. D’Amore, G.J. Hawley. 2008. Inuence of simulated snow cover on the cold tolerance and freezing injury of yellow-cedar seedlings. Global Change Biology, 14:1-12. doi: 10.1111/j.1365-2486.2008.01577.x [2] Forest Service. Alaska Cedar (Chamaecyparis nootkatensis) Summary. https://www.na.fs.fed. us/spfo/pubs/silvics_manual/Volume_1/chamaecyparis/nootkatensis.htm [3] Grith, R.S. 1992. Callitropsis nootkatensis. In: Fire Eects Information System, [Online]. U.S. Department of Agriculture, Forest Service, Rocky Mountain Research Station, Fire Sciences Laboratory (Producer). Available: http://www.fs.fed.us/database/feis/plants/tree/calnoo/all. html [2017, November 12]. [4] Mauger, G.S., J.H. Casola, H.A. Morgan, R.L. Strauch, B. Jones, B.

21 Curry, T.M. Busch Isaksen, L. Whitely
Curry, T.M. Busch Isaksen, L. Whitely Binder, M.B. Krosby, and A.K. Snover. 2015. State of Knowledge: Climate Change in Puget Sound. Climate Impacts Group, University of Washington, Seattle. IMAGE CREDIT Front Page: Alaska cedar by Megan Hansen, used under CC BY-NC-ND 2.0 Back Page: Alaska cedar by Brew Brooks, used under CC BY-NC-ND 2.0 LIMITED DISPERSAL ABILITIES Direct information on seed dispersal distance is not available for the Alaska cedar. However, it is noted that Alaska cedar seeds are heavier than Port- Orford-cedar seeds and are therefore unlikely to be dispersed more than 120 meters from the source. 2 The relatively poor dispersal abilities of Alaska cedar seeds decreases the likelihood that the species will be able to move and keep pace with shifting climate conditions. DEPENDENCE ON COOL OR COLD HABITATS The Alaska cedar is restricted to relatively cool/cold regions within Washington’s Cascade Range. The species is found between 600 - 2,300 m. 3 This dependence on cool, higher elevation habitats increases the species vulnerability to climate change, as these areas are thought to be more prone to habitat loss or reduction with warming temperatures. CHANGES IN STREAMFLOW AND WATER AVAILABILITY The Alaska cedar is known to grow on bog and semi-bog. 2 Projected increases in temperatures and declines in summer precipitation 4 may reduce moisture availability in these habitats, potentially reducing the habitat suitability of some areas for the Alaska cedar. RCP 8.5 RCP 4.5 FACTORS THAT INCREASE THE PINTAIL’S VULNERABILITY TO CLIMATE CHANGE: CHANGES IN STREAMFLOW AND WATER AVAILABILITY The northern pintail is dependent on small, shallow, semi-permanent wetlands and marshes. 1 These semi

22 - permanent habitats may be susceptible
- permanent habitats may be susceptible to declining summer precipitation and increased risk of summer low �ows. 2 These changes may increase the likelihood of premature drying of these wetlands and marshes, which would negatively aect the northern pintail. FACTORS THAT SOMEWHAT INCREASE THE PINTAIL’S VULNERABILITY TO CLIMATE CHANGE: LIMITED EXPOSURE TO PAST VARIATIONS IN TEMPERATURE This factor measures the range of average seasonal temperatures (the dierence between the highest average monthly maximum temperature and lowest average monthly minimum temperature) observed for a species’ distribution within the assessment area in recent historical times (1970-1999). Species that have experienced a narrower range of historical temperatures are expected to be more sensitive to future warming. NORTHERN PINTAIL SENSITIVITY TO CLIMATE CHANGE RCP 8.5 RCP 4.5 VULNERABILITY TO CLIMATE CHANGE The northern pintail is estimated to be less vulnerable to climate change by the 2050s under a low (RCP 4.5) greenhouse gas scenario and moderately vulnerable by the 2050s under a high (RCP 8.5) greenhouse gas scenario. This ranking reects both projected future changes in climate as well as the northern pintail’s estimated sensitivity to climate change. Key climate sensitivities for the northern pintail are discussed below. Anas acuta 2050s 2080s Less Vulnerable Moderately Vulnerable Moderately Vulnerable Moderately Vulnerable FOR MORE INFORMATION This fact sheet is a product of the Nooksack Indian Tribe Natural Resources Climate Change Vulnerability Assessment. For more information on the northern pintail’s sensitivity and vulnerability to climate change or to nd out more about the overall

23 assessment results please reference th
assessment results please reference the report or contact the University of Washington Climate Impacts Group (https:// cig.uw.edu; cig@uw.edu). Morgan, H., and M. Krosby. 2017. Nooksack Indian Tribe Natural Resources Climate Change Vulnerability Assessment. Climate Impacts Group, University of Washington. CITATIONS [1] MClark, Robert G., Joseph P. Fleskes, Karla L. Guyn, David A. Haukos, Jane E. Austin and Michael R. Miller. 2014. Northern Pintail (Anas acuta), version 2.0. In The Birds of North America (P. G. Rodewald, editor). Cornell Lab of Ornithology, Ithaca, New York, USA. [2] Mauger, G.S., J.H. Casola, H.A. Morgan, R.L. Strauch, B. Jones, B. Curry, T.M. Busch Isaksen, L. Whitely Binder, M.B. Krosby, and A.K. Snover. 2015. State of Knowledge: Climate Change in Puget Sound. Climate Impacts Group, University of Washington, Seattle. IMAGE CREDIT Front Page: Northern pintail by Smudge 9000, used under CC BY-NC-ND 2.0 Back Page: Northern pintail by Barry Badcock, used under CC BY-NC-ND 2.0 RCP 8.5 RCP 4.5 FACTORS THAT INCREASE THE GROUSE’S VULNERABILITY TO CLIMATE CHANGE: LIMITED EXPOSURE TO PAST VARIATIONS IN TEMPERATURE This factor measures the range of average seasonal temperatures (the dierence between the highest average monthly maximum temperature and lowest average monthly minimum temperature) observed for a species’ distribution within the assessment area in recent historical times (1970-1999). Species that have experienced a narrower range of historical temperatures are expected to be more sensitive to future warming. FACTORS THAT SOMEWHAT INCREASE THE GROUSE’S VULNERABILITY TO CLIMATE CHANGE: OCCURRENCE OF MANMADE BARRIERS Roads, urban areas, industrial areas, agricultural lands,

24 and logging roads have all been identi&
and logging roads have all been identied as anthropogenic barriers to sooty grouse dispersal. 1,2 The sooty grouse may have diculty ying over many of these barriers due to its limited dispersal abilities. These barriers may thus slightly decrease the ability of the sooty grouse to adjust its range in response to changing climate conditions. SOOTY GROUSE SENSITIVITY TO CLIMATE CHANGE RCP 8.5 RCP 4.5 VULNERABILITY TO CLIMATE CHANGE The sooty grouse is estimated to be less vulnerable to climate change by the 2050s under a low (RCP 4.5) greenhouse gas scenario and moderately vulnerable by the 2050s under a high (RCP 8.5) greenhouse gas scenario. The grouse is estimated to be moderately vulnerable to climate change by the 2080s under both a low and high greenhouse gas scenario. This ranking reects both projected future changes in climate as well as the sooty grouse’s estimated sensitivity to climate change. Key climate sensitivities for the sooty grouse are discussed below. Dendragapus fuliginosus 2050s 2080s Less Vulnerable Moderately Vulnerable Moderately Vulnerable Moderately Vulnerable FOR MORE INFORMATION This fact sheet is a product of the Nooksack Indian Tribe Natural Resources Climate Change Vulnerability Assessment. For more information on the sooty grouse’s sensitivity and vulnerability to climate change or to nd out more about the overall assessment results please reference the report or contact the University of Washington Climate Impacts Group (https:// cig.uw.edu; cig@uw.edu). Morgan, H., and M. Krosby. 2017. Nooksack Indian Tribe Natural Resources Climate Change Vulnerability Assessment. Climate Impacts Group, University of Washington. CITATIONS [1] Nooksack Tribe s

25 ta, personal communication. [2] C
ta, personal communication. [2] Climate Change Sensitivity Database. Sooty Grouse (Dendragapus fuliginosus). IMAGE CREDIT Front Page: Sooty grouse by Joe, used under CC BY-NC-ND 2.0 Back Page: Sooty grouse by J. Maughn, used under CC BY-NC-ND 2.0 RCP 8.5 RCP 4.5 FACTORS THAT INCREASE THE WESTERN REDCEDAR’S VULNERABILITY TO CLIMATE CHANGE: LIMITED EXPOSURE TO PAST VARIATIONS IN TEMPERATURE This factor measures the range of average seasonal temperatures (the dierence between the highest average monthly maximum temperature and lowest average monthly minimum temperature) observed for a species’ distribution within the assessment area in recent historical times (1970-1999). Species that have experienced a narrower range of historical temperatures are expected to be more sensitive to future warming. LIMITED GENETIC DIVERSITY The western redcedar has one of the lowest levels of genetic diversity among conifers. 1 Species with low levels of genetic diversity are expected to be less able to adapt to changing climate conditions. WESTERN REDCEDAR SENSITIVITY TO CLIMATE CHANGE RCP 8.5 RCP 4.5 VULNERABILITY TO CLIMATE CHANGE The western redcedar is estimated to be highly vulnerable to climate change by the 2050s under a low (RCP 4.5) greenhouse gas scenario and extremely vulnerable by the 2050s under a high (RCP 8.5) greenhouse gas scenario. The western redcedar is estimated to be extremely vulnerable to climate change by the 2080s under both a low and high greenhouse gas scenario. This ranking reects both projected future changes in climate as well as the western redcedar’s estimated sensitivity to climate change. Key climate sensitivities for the western redcedar are discussed below. Thuja plicata

26 2050s 2080s Highly Vulnerable Extremely
2050s 2080s Highly Vulnerable Extremely Vulnerable Extremely Vulnerable Extremely Vulnerable FOR MORE INFORMATION This fact sheet is a product of the Nooksack Indian Tribe Natural Resources Climate Change Vulnerability Assessment. For more information on the western redcedar’s sensitivity and vulnerability to climate change or to nd out more about the overall assessment results please reference the report or contact the University of Washington Climate Impacts Group (https:// cig.uw.edu; cig@uw.edu). Morgan, H., and M. Krosby. 2017. Nooksack Indian Tribe Natural Resources Climate Change Vulnerability Assessment. Climate Impacts Group, University of Washington. CITATIONS [1] Tesky, Julie L. 1992. Thuja plicata. In: Fire Eects Information System, [Online]. U.S. Department of Agriculture, Forest Service, Rocky Mountain Research Station, Fire Sciences Laboratory (Producer). Available: http://www.fs.fed.us/database/feis/plants/tree/thupli/all. html [2017, November 12]. [2] Sturrock, R.N., S.J. Frankel, A.V Brown, P.E. Hennon, J.T. Kliejunas, K.J. Lewis, J.J. Worrall, A.J. Woods. 2011. Climate change and forest diseases. Plant Pathology, 60:133-149. IMAGE CREDIT Front Page: Western redcedar by Eric Hunt, used under CC BY-NC-ND 2.0 Back Page: Western redcedar by brewbooks, used under CC BY-NC-ND 2.0 FACTORS THAT SOMEWHAT INCREASE THE WESTERN REDCEDAR’S VULNERABILITY TO CLIMATE CHANGE: LIMITED DISPERSAL ABILITIES Western redcedar seeds are wind dispersed. However, the seed’s small wings limit its dispersal distance to ~120 meters. 1 The relatively poor dispersal abilities of the western redcedar may decrease its ability to adjust its range in response to changing climate conditions. SENSITIVI

27 TY TO PATHOGENS The western redcedar is
TY TO PATHOGENS The western redcedar is susceptible to numerous insects, pathogens, and pests. It is challenging to make generalizations of the responses of diseases and pests to climate change because the responses will largely be species specic. Some diseases/pests may become more widespread while others may not. For example, western redcedar is susceptible to armellaria root disease. If climate change results in a warmer and drier climate armellaria impact is projected to increase. Conversely, if climate change results in a warmer and wetter climate, the impact of armellaria is projected to remain the same. 2 RCP 8.5 RCP 4.5 FACTORS THAT INCREASE THE BOG CRANBERRY’S VULNERABILITY TO CLIMATE CHANGE: LIMITED EXPOSURE TO PAST VARIATIONS IN TEMPERATURE This factor measures the range of average seasonal temperatures (the dierence between the highest average monthly maximum temperature and lowest average monthly minimum temperature) observed for a species’ distribution within the assessment area in recent historical times (1970-1999). Species that have experienced a narrower range of historical temperatures are expected to be more sensitive to future warming. FACTORS THAT SOMEWHAT INCREASE THE BOG CRANBERRY’S VULNERABILITY TO CLIMATE CHANGE: OCCURRENCE OF MANMADE BARRIERS The region north of the Nooksack watershed is largely bordered by developed agricultural land, which may limit to ability of the bog cranberry to adjust its range in response to changing climate conditions. BOG CRANBERRY SENSITIVITY TO CLIMATE CHANGE RCP 8.5 RCP 4.5 VULNERABILITY TO CLIMATE CHANGE The bog cranberry is estimated to be moderately vulnerable to climate change by the 2050s under a low (RCP 4.5) greenhouse ga

28 s scenario and highly vulnerable by the
s scenario and highly vulnerable by the 2050s under a high (RCP 8.5) greenhouse gas scenario. The bog cranberry is estimated to be highly vulnerable to climate change by the 2080s under both a low scenario and extremely vulnerable under a high greenhouse gas scenario. This ranking reects both projected future changes in climate as well as the bog cranberry’s estimated sensitivity to climate change. Key climate sensitivities for the bog cranberry are discussed below. Vaccinium oxycoccos 2050s 2080s Moderately Vulnerable Extremely Vulnerable Highly Vulnerable Highly Vulnerable FOR MORE INFORMATION This fact sheet is a product of the Nooksack Indian Tribe Natural Resources Climate Change Vulnerability Assessment. For more information on the bog cranberry’s sensitivity and vulnerability to climate change or to nd out more about the overall assessment results please reference the report or contact the University of Washington Climate Impacts Group (https:// cig.uw.edu; cig@uw.edu). Morgan, H., and M. Krosby. 2017. Nooksack Indian Tribe Natural Resources Climate Change Vulnerability Assessment. Climate Impacts Group, University of Washington. CITATIONS [1] Matthews, Robin F. 1992. Vaccinium oxycoccos. In: Fire Eects Information System, [Online]. U.S. Department of Agriculture, Forest Service, Rocky Mountain Research Station, Fire Sciences Laboratory (Producer). Available: http://www.fs.fed.us/database/feis/ [2017, November 5]. IMAGE CREDIT Front Page: Vaccinium oxycoccus by B. Lezius, used under CC BY-NC-ND 3.0 Back Page: Bog cranberry by Wplynn, used under CC BY-NC-ND 2.0 CHANGES IN STREAMFLOW AND WATER AVAILABILITY The bog cranberry grows in bogs and fens occurring in wet coastal and boreal

29 forests. These sites are poorly drained
forests. These sites are poorly drained with a high-water table. In these areas, the ground is saturated for most of the year. 1 Rising temperatures and projected declines in summer precipitation and summer streamows may dry out these bog and fen sites, negatively aecting bog cranberry. DEPENDENCE ON RARE LANDSCAPE FEATURES The bog cranberry is restricted to acidic conditions, thriving in soils with pH between 2.9-4.7. 1 Species that are dependent on uncommon geologic features are less likely to be able to adapt to climate change. RCP 8.5 RCP 4.5 FACTORS THAT INCREASE THE ALASKA BLUEBERRY’S VULNERABILITY TO CLIMATE CHANGE: LIMITED EXPOSURE TO PAST VARIATIONS IN TEMPERATURE This factor measures the range of average seasonal temperatures (the dierence between the highest average monthly maximum temperature and lowest average monthly minimum temperature) observed for a species’ distribution within the assessment area in recent historical times (1970-1999). Species that have experienced a narrower range of historical temperatures are expected to be more sensitive to future warming. FACTORS THAT SOMEWHAT INCREASE THE ALASKA BLUEBERRY’S VULNERABILITY TO CLIMATE CHANGE: OCCURRENCE OF MANMADE BARRIERS The region north of the Nooksack watershed is largely bordered by developed agricultural land, which may limit to ability of the Alaska blueberry to adjust its range in response to changing climate conditions. ALASKA BLUEBERRY SENSITIVITY TO CLIMATE CHANGE RCP 8.5 RCP 4.5 VULNERABILITY TO CLIMATE CHANGE The Alaska blueberry is estimated to be moderately vulnerable to climate change by the 2050s under a low (RCP 4.5) greenhouse gas scenario and highly vulnerable by the 2050s under a high (RCP

30 8.5) greenhouse gas scenario. The Alas
8.5) greenhouse gas scenario. The Alaska blueberry is estimated to be highly vulnerable to climate change by the 2080s under both a low scenario and extremely vulnerable under a high greenhouse gas scenario. This ranking reects both projected future changes in climate as well as the Alaska blueberry’s estimated sensitivity to climate change. Key climate sensitivities for the Alaska blueberry are discussed below. Vaccinium alaskaense 2050s 2080s Moderately Vulnerable Extremely Vulnerable Highly Vulnerable Highly Vulnerable FOR MORE INFORMATION This fact sheet is a product of the Nooksack Indian Tribe Natural Resources Climate Change Vulnerability Assessment. For more information on the Alaska blueberry’s sensitivity and vulnerability to climate change or to nd out more about the overall assessment results please reference the report or contact the University of Washington Climate Impacts Group (https:// cig.uw.edu; cig@uw.edu). Morgan, H., and M. Krosby. 2017. Nooksack Indian Tribe Natural Resources Climate Change Vulnerability Assessment. Climate Impacts Group, University of Washington. CITATIONS [1] Matthews, Robin F. 1992. Vaccinium alaskensis. In: Fire Eects Information System, [Online]. U.S. Department of Agriculture, Forest Service, Rocky Mountain Research Station, Fire Sciences Laboratory (Producer). Available: http://www.fs.fed.us/database/feis/ [2017, November 12]. IMAGE CREDIT Front Page: Blueberries by Dave Brenner, used under CC BY-NC-ND 2.0 Back Page: Blueberry by Dave Brenner, used under CC BY-NC-ND 2.0 DEPENDENCE ON POLLINATORS Alaska blueberry owers are pollinated by bumble bees. Common bumble bee species in western Washington include the black-tailed bumble bee,

31 yellow bumble bee, fuzzy horned bumble b
yellow bumble bee, fuzzy horned bumble bee, and the yellow faced bumble bee. Species that are reliant on a limited number of pollinators are potentially more vulnerable to environmental changes resulting from climate change. REPRODUCTIVE SYSTEM The Alaska blueberry is able to reproduce both vegetatively and via seed production. Vegetative reproduction has been noted to be of particular importance to western Vaccinium species. 1 Species that rely on vegetative reproduction are assumed to have lower levels of genetic variation and therefore, may be more vulnerable to changing climate conditions. RCP 8.5 RCP 4.5 FACTORS THAT INCREASE THE BROADLEAF CATTAIL’S VULNERABILITY TO CLIMATE CHANGE: LIMITED EXPOSURE TO PAST VARIATIONS IN TEMPERATURE This factor measures the range of average seasonal temperatures (the dierence between the highest average monthly maximum temperature and lowest average monthly minimum temperature) observed for a species’ distribution within the assessment area in recent historical times (1970-1999). Species that have experienced a narrower range of historical temperatures are expected to be more sensitive to future warming. FACTORS THAT SOMEWHAT INCREASE THE BROADLEAF CATTAIL’S VULNERABILITY TO CLIMATE CHANGE: LIMITED GENETIC DIVERSITY Genetic variation in the broadleaf cattail has been reported as “extremely low.” It is hypothesized that self- pollination and clonal growth are the primary drivers of these low levels of genetic variation. 1 Species with low levels of genetic diversity are expected to be less able to adapt to changing climate conditions. BROADLEAF CATTAIL SENSITIVITY TO CLIMATE CHANGE RCP 8.5 RCP 4.5 VULNERABILITY TO CLIMATE CHANGE The broadleaf cattail is es

32 timated to be moderately vulnerable to c
timated to be moderately vulnerable to climate change by the 2050s under a low (RCP 4.5) greenhouse gas scenario and extremely vulnerable by the 2050s under a high (RCP 8.5) greenhouse gas scenario. The broadleaf cattail is estimated to be extremely vulnerable to climate change by the 2080s under both a low and high greenhouse gas scenario. This ranking reects both projected future changes in climate as well as the broadleaf cattail’s estimated sensitivity to climate change. Key climate sensitivities for the broadleaf cattail are discussed below. Typha latifolia 2050s 2080s Moderately Vulnerable Extremely Vulnerable Extremely Vulnerable Extremely Vulnerable FOR MORE INFORMATION This fact sheet is a product of the Nooksack Indian Tribe Natural Resources Climate Change Vulnerability Assessment. For more information on the broadleaf cattail’s sensitivity and vulnerability to climate change or to nd out more about the overall assessment results please reference the report or contact the University of Washington Climate Impacts Group (https:// cig.uw.edu; cig@uw.edu). Morgan, H., and M. Krosby. 2017. Nooksack Indian Tribe Natural Resources Climate Change Vulnerability Assessment. Climate Impacts Group, University of Washington. CITATIONS [1] Gucker, C. L. 2008. Typha latifolia. In: Fire Eects Information System, [Online]. U.S. Department of Agriculture, Forest Service, Rocky Mountain Research Station, Fire Sciences Laboratory (Producer). Available: http://www.fs.fed.us/database/feis/ [2017, November 12]. IMAGE CREDIT Front Page: Cattails by LongtiudeLatitude, used under CC BY-NC-ND 2.0 Back Page: Cattail by WI DNR, used under CC BY-NC-ND 2.0 RCP 8.5 RCP 4.5 FACTORS THAT INCREASE THE EVERG

33 REEN HUCKLEBERRY’S VULNERABILITY TO CL
REEN HUCKLEBERRY’S VULNERABILITY TO CLIMATE CHANGE: LIMITED EXPOSURE TO PAST VARIATIONS IN TEMPERATURE This factor measures the range of average seasonal temperatures (the dierence between the highest average monthly maximum temperature and lowest average monthly minimum temperature) observed for a species’ distribution within the assessment area in recent historical times (1970-1999). Species that have experienced a narrower range of historical temperatures are expected to be more sensitive to future warming. FACTORS THAT SOMEWHAT INCREASE THE EVERGREEN HUCKLEBERRY’S VULNERABILITY TO CLIMATE CHANGE: OCCURRENCE OF MANMADE BARRIERS The region north of the Nooksack watershed is largely bordered by developed agricultural land, which may limit the ability of the evergreen huckleberry to adjust its range in response to changing climate conditions. EVERGREEN HUCKLEBERRY SENSITIVITY TO CLIMATE CHANGE RCP 8.5 RCP 4.5 VULNERABILITY TO CLIMATE CHANGE The evergreen huckleberry is estimated to be moderately vulnerable to climate change by the 2050s under a low (RCP 4.5) greenhouse gas scenario and extremely vulnerable by the 2050s under a high (RCP 8.5) greenhouse gas scenario. The evergreen huckleberry is estimated to be extremely vulnerable to climate change by the 2080s under both a low and high greenhouse gas scenario. This ranking reects both projected future changes in climate as well as the evergreen huckleberry’s estimated sensitivity to climate change. Key climate sensitivities for the evergreen huckleberry are discussed below. Vaccinium ovatum 2050s 2080s Moderately Vulnerable Extremely Vulnerable Extremely Vulnerable Extremely Vulnerable FOR MORE INFORMATION This fact sheet is a product

34 of the Nooksack Indian Tribe Natural Re
of the Nooksack Indian Tribe Natural Resources Climate Change Vulnerability Assessment. For more information on the evergreen huckleberry’s sensitivity and vulnerability to climate change or to nd out more about the overall assessment results please reference the report or contact the University of Washington Climate Impacts Group (https:// cig.uw.edu; cig@uw.edu). Morgan, H., and M. Krosby. 2017. Nooksack Indian Tribe Natural Resources Climate Change Vulnerability Assessment. Climate Impacts Group, University of Washington. CITATIONS [1] Tirmenstein, D. 1990. Vaccinium ovatum. In: Fire Eects Information System, [Online]. U.S. Department of Agriculture, Forest Service, Rocky Mountain Research Station, Fire Sciences Laboratory (Producer). Available: http://www.fs.fed.us/database/feis/ IMAGE CREDIT Front Page: Vaccinium ovatum by James Gaither, used under CC BY-NC-ND 2.0 Back Page: Vaccinium ovatum by John Rusk, used under CC BY-NC-ND 2.0 DEPENDENCE ON RARE LANDSCAPE FEATURES The evergreen huckleberry is restricted to acidic conditions, thriving in soils with pH between 4.3-5.2. 1 Association with a specic geologic feature is expected to limit the evergreen huckleberry’s ability to adapt to climate change. DEPENDENCE ON POLLINATORS Evergreen huckleberry owers are pollinated by long-tongued bees (i.e., bumble bees). 1 Common bumble bee species in western Washington include the black-tailed bumble bee, yellow bumble bee, fuzzy horned bumble bee, and the yellow faced bumble bee. Species that are reliant on a limited number of pollinators are potentially more vulnerable to environmental changes resulting from climate change. REPRODUCTIVE SYSTEM The evergreen huckleberry is able to rep

35 roduce vegetatively and also via seed p
roduce vegetatively and also via seed production. Vegetative reproduction has been noted of particular importance to western Vaccinium species. 1 Species that primarily reproduce vegetatively are assumed to have lower levels of genetic variation and therefore may be more vulnerable to changing climate conditions. RCP 8.5 RCP 4.5 FACTORS THAT INCREASE THE BEAKED HAZELNUT’S VULNERABILITY TO CLIMATE CHANGE: LIMITED EXPOSURE TO PAST VARIATIONS IN TEMPERATURE This factor measures the range of average seasonal temperatures (the dierence between the highest average monthly maximum temperature and lowest average monthly minimum temperature) observed for a species’ distribution within the assessment area in recent historical times (1970-1999). Species that have experienced a narrower range of historical temperatures are expected to be more sensitive to future warming. FACTORS THAT SOMEWHAT INCREASE THE BEAKED HAZELNUT’S VULNERABILITY TO CLIMATE CHANGE: DEPENDENCE ON DISTURBANCE EVENTS While many disturbance events – including re, insects, and disease – may increase the frequency of hazelnut presence, ooding has been shown to negatively aect the beaked hazelnut. 1 Projected increases in winter ood risk may thus negatively aect beaked hazelnut habitat. BEAKED HAZELNUT SENSITIVITY TO CLIMATE CHANGE RCP 8.5 RCP 4.5 VULNERABILITY TO CLIMATE CHANGE The beaked hazelnut is estimated to be moderately vulnerable to climate change by the 2050s under a low (RCP 4.5) greenhouse gas scenario and highly vulnerable by the 2050s under a high (RCP 8.5) greenhouse gas scenario. The beaked hazelnut is estimated to be highly vulnerable to climate change by the 2080s under a low greenhouse ga

36 s scenario and extremely vulnerable unde
s scenario and extremely vulnerable under high greenhouse gas scenario. This ranking reects both projected future changes in climate as well as the beaked hazelnut’s estimated sensitivity to climate change. Key climate sensitivities for the beaked hazelnut are discussed below. Corylus cornuta 2050s 2080s Moderately Vulnerable Extremely Vulnerable Highly Vulnerable Highly Vulnerable FOR MORE INFORMATION This fact sheet is a product of the Nooksack Indian Tribe Natural Resources Climate Change Vulnerability Assessment. For more information on the beaked hazelnut’s sensitivity and vulnerability to climate change or to nd out more about the overall assessment results please reference the report or contact the University of Washington Climate Impacts Group (https:// cig.uw.edu; cig@uw.edu). Morgan, H., and M. Krosby. 2017. Nooksack Indian Tribe Natural Resources Climate Change Vulnerability Assessment. Climate Impacts Group, University of Washington. CITATIONS [1] Fryer, Janet L. 2007. Corylus cornuta. In: Fire Eects Information System, [Online]. U.S. Department of Agriculture, Forest Service, Rocky Mountain Research Station, Fire Sciences Laboratory (Producer). Available: http://www.fs.fed.us/database/feis/ [2017, November 12]. IMAGE CREDIT Front Page: Vaccinium ovatum by James Gaither, used under CC BY-NC-ND 2.0 Back Page: Vaccinium ovatum by John Rusk, used under CC BY-NC-ND 2.0 REPRODUCTIVE SYSTEM While the beaked hazelnut is capable of both sexual and vegetative reproduction, vegetative means of reproduction are more common. 1 Species that primarily reproduce vegetatively are assumed to have lower levels of genetic variation and therefore may be more vulnerable to changing climatic c