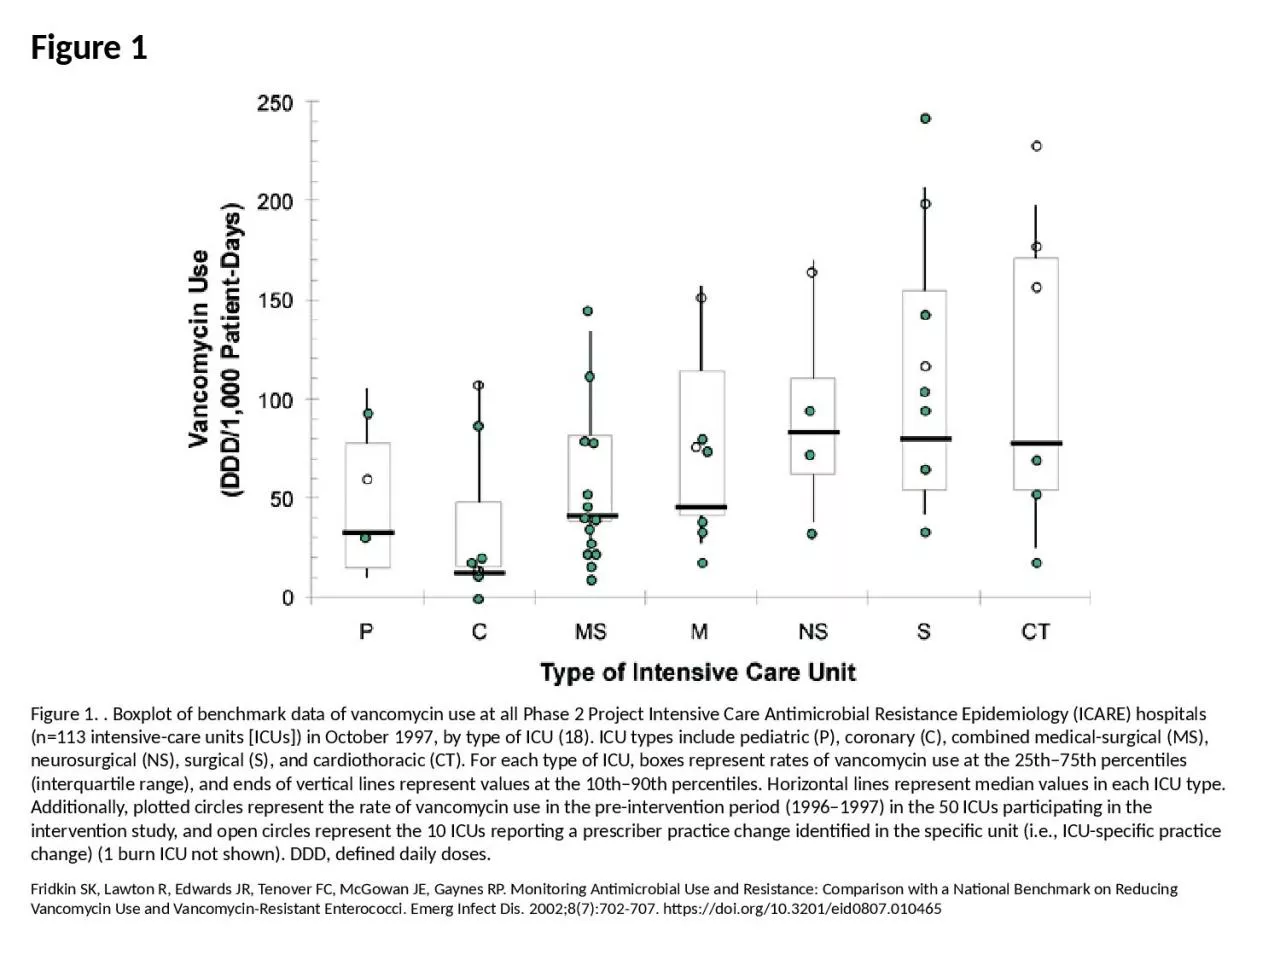
PPT-Figure 1 Figure 1. . Boxplot of benchmark data of vancomycin use at all Phase 2 Project
Author : holly | Published Date : 2023-12-30
Fridkin SK Lawton R Edwards JR Tenover FC McGowan JE Gaynes RP Monitoring Antimicrobial Use and Resistance Comparison with a National Benchmark on Reducing Vancomycin
Presentation Embed Code
Download Presentation
Download Presentation The PPT/PDF document "Figure 1 Figure 1. . Boxplot of benchmar..." is the property of its rightful owner. Permission is granted to download and print the materials on this website for personal, non-commercial use only, and to display it on your personal computer provided you do not modify the materials and that you retain all copyright notices contained in the materials. By downloading content from our website, you accept the terms of this agreement.
Figure 1 Figure 1. . Boxplot of benchmark data of vancomycin use at all Phase 2 Project: Transcript
Download Rules Of Document
"Figure 1 Figure 1. . Boxplot of benchmark data of vancomycin use at all Phase 2 Project"The content belongs to its owner. You may download and print it for personal use, without modification, and keep all copyright notices. By downloading, you agree to these terms.
Related Documents


![[READ] - Neonatal Intensive Care Nurse Exam Secrets Study Guide: Neonatal Nurse Test](https://thumbs.docslides.com/902492/read-neonatal-intensive-care-nurse-exam-secrets-study-guide-neonatal-nurse-test-review-for-the-neonatal-intensive-care-nurse-exam.jpg)