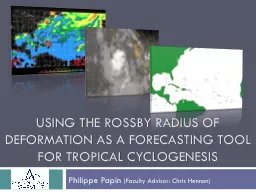
Philippe Papin Faculty Advisor Chris Hennon Outline Tropical Cyclogenesis background Forecasting TCG Rossby Radius of Deformation RROD Equation and Diagrams Using RROD Methodology Results ID: 780367
Download The PPT/PDF document "Using the Rossby Radius of Deformation a..." is the property of its rightful owner. Permission is granted to download and print the materials on this web site for personal, non-commercial use only, and to display it on your personal computer provided you do not modify the materials and that you retain all copyright notices contained in the materials. By downloading content from our website, you accept the terms of this agreement.
Slide1
Using the Rossby Radius of Deformation as a Forecasting Tool for Tropical Cyclogenesis
Philippe Papin (Faculty Advisor: Chris Hennon)
Slide2Outline
Tropical Cyclogenesis backgroundForecasting TCGRossby Radius of Deformation (RROD)Equation and Diagrams
Using RRODMethodologyResultsIdentifying Best Prediction TechniqueContingency Table ForecastingComparing to Other StudiesComplications and Future WorkIncorporation into other studies
Slide3Tropical Cyclogenesis (TCG)
Formation of a tropical cyclone through an initial disturbance over open watersTropical Cloud Clusters (TCC)Areas of thunderstorms that have potential to develop into a tropical cyclone
Slide4How Tropical Cyclones Develop (Gray 1968)
Sufficient Sea Surface Temperatures (at or greater than 26.5oC ~80oF)
Source of Latent Heat for tropical cyclonesWeak Vertical Wind ShearSmall change of winds with heightLow Level Relative VorticityInitial spinMoist Mid Levels
High relative humidity
Dry Air
Moist Air
Strong Wind Shear
Weak Wind Shear
Wind Shear Diagram
Low Levels
Mid Levels
Upper Levels
Slide5Forecasting Tropical Cyclogenesis
Rare Event90% of all Atlantic Basin tropical cyclone ‘seedlings’ fail to develop despite favorable conditions. (Hennon et. al 2005)Challenges
Insufficient Computer Model resolutionSmall scale processes aid developing in TCCsFew In-situ observations in AtlanticComputer models and Satellite imagery used for forecasting
Slide6Potential For Operational Forecasting Parameter for TCG
Previous Studies have sought to find a parameter useful in TCGLow Level VorticityDaily Genesis Potential
Discriminant AnalysisCombination of multiple variables Using Rossby Radius of Deformation?
Slide7Storm Radius
Latent Heat
Systems
Dissapates
Storm Radius
Latent Heat
Systems Persists
Distance at which energy disperses by atmospheric waves from the center of a circulation
If this distance exceeds the storm radius, the energy disperses too far away and the system tends to dissipate.
If this distance is contained within the system radius, the storm will persist.
What is the
Rossby
Radius of Deformation?
Slide8Rossby Radius of Deformation
Defined asN = Brunt–Väisälä frequencyH = Depth of the system
ζ = Relative Vorticity
f0 = Coriolis parameter (planetary vorticity) Critical Boundary where rotation becomes as important as buoyancy
Brunt–Väisälä frequency g = Gravityθ = Potential TemperatureZ = Geometric Height
Slide9RROD as a Forecasting Parameter
Decreasing Values of RROD typically indicate where conditions are more favorable for developmentA RROD value can be assigned to a tropical cloud clusterSynoptic Conditions = Model Analysis
Storm Height = Cloud Top Height
Slide10Methodology for RROD
DatasetUsed Global Forecasting System (GFS) computer model analyses to obtain these variablesTemperaturePressure
Geopotential HeightAbsolute Vorticity
Slide11DatasetAtlantic Tropical Cloud Cluster Dataset (Hennon et al. 2011) was incorporated to test RROD for particular disturbances
Cloud shield of cluster was used as storm radius Cloud top height used as storm height
Methodology for RROD(cont.)
Slide12Preliminary map was created to show if RROD was a feasible value to use for tropical cyclonesCompare the RROD field with the satellite imagery at the same time.
Notice the correlation of low RROD values with clusters/tropical cyclonesCorrelation will be pursued to see if it is useful for tropical cyclogenesis
Preliminary RROD Field
Three Obvious RROD Minimums
Slide13Algorithm for RROD
GFS Data
TCC Data
Developing / Non-Developing
Fetch Data
Calculate BVF and RROD
Identify grid points within TCC radius
RROD File Output
RROD value calculated every 6 hours until TCC dissipates or develops
Slide14Atlantic Tropical Cloud Cluster Dataset1193 clusters were identified from 2004-2008
65 developing clusters
Cloud Cluster Statistics for the Atlantic Basin
Year
Clusters
Developing
Clusters
Development Ratio
2004
214
13
6.07%
2005
266
22
8.27%
2006
238
8
3.36%
2007
222
10
4.50%
2008
253
12
4.74%
Note the low development ratio
Slide15Methods For Improving RROD Calculation
Use vorticity at multiple levels10 levels used for vorticity (925 hPa to 500 hPa)Captures entire scope of circulation, not just a single heightUse mean cluster radius over max radius
Max radius is the furthest extent of the cloud shieldMean radius is the mean extent of the cloud shieldBetter at only capturing only convective elements, with no cloudless air
Convection
Max Radius
Mean Radius
Slide16Methods For Improving RROD AlgorithmRossby
Radius Ratio (RRR)The environmentally derived RROD divided by the actual storm radius to provide the ratioIn theory, the lower the number, the more energy is contained within the TCCBetter value than RROD alone since it takes into account the size of the cluster
Slide17RROD Algorithm ResultsSubstantially lower average RROD in developing cases than non-developing cases
Note, developing cases occurred at or before 48 hours of cluster initiationMean RRR better discriminator for developmentNote the increased difference in developing and non-developing clusters for RRR mean.Nice, but means not a great statistic for variables with high variance
Select Values From RROD Algorithm
Type of Tropical Cloud Cluster
RRODmax (km)
RRODmean (km)
RADIUSmax
(km)
RADIUSmean (km)
RRRmax
RRRmean
Developing
3485.68
2997.58
248.10
149.99
15.63
21.81
Non-Developing
11629.81
11417.74
255.93
147.66
50.79
84.44
Slide18Threshold Value for RRRUse of a single value that if exceeded indicates an event has or has not taken place
In this case, if RRR goes beyond a certain value, a TCC won’t developSort results into a contingency table1 Indicates development0 Indicates non-development
Contingency Table for each RRR1-50 RRR units How can we score this?
Slide19Skill Scores for Contingency TablesProbability of DetectionAbility to classify a developing cluster correctly
1 is a perfect scoreFalse Alarm RateRatio of false alarms to total number of occurrences0 is a perfect score
POD
FAR
=
Skill Scores for Contingency TablesHeidke Skill Score
Combination of both the POD and FARA more useful skill score for rare events such as tropical cyclogenesis (Marzban 1998)
Perfect score is 1 with a random score being 0
HSS =
Slide21Picking a Threshold ValueDepends on what skill score is most important for the particular studyEx. POD is particularly important for Tornadoes
Most efficient combination of POD and FAR is desirable for TCG forecastingHeidke Skill Score
Slide22Best HSS value was .17 found at an RRR value of 17
POD of .42 and FAR of .13 for same RRR value
Seems like a low number right?Results – Skill Score Tests For RRR
Slide23Kerns and Zipser (2009)HSS found at .37 for a 6-48 hour forecast period (POD .39 and FAR .04)
Slightly more than double findings of this studyUsed
discriminant analysis of a multitude of predictors (10) Comparison To Other Studies
Slide24Overall ConclusionsRROD determines the distance as which energy travels away from a tropical cloud cluster RRR is a useful ratio in comparing the RROD to the actual radius of a cluster
Contingency Tables are useful in identifying a threshold value that produces the best prediction capability of RRRWhile HSS value is lower than previous studies, this is only based on one predictor as opposed to 10.
Slide25Future Work Employ RRR into other prediction schemesHennon et al. (2005)
Increase Sample Size of StudyTCC database is reliable all the way to 1982Incorporate other ocean basins
Slide26Works Cited