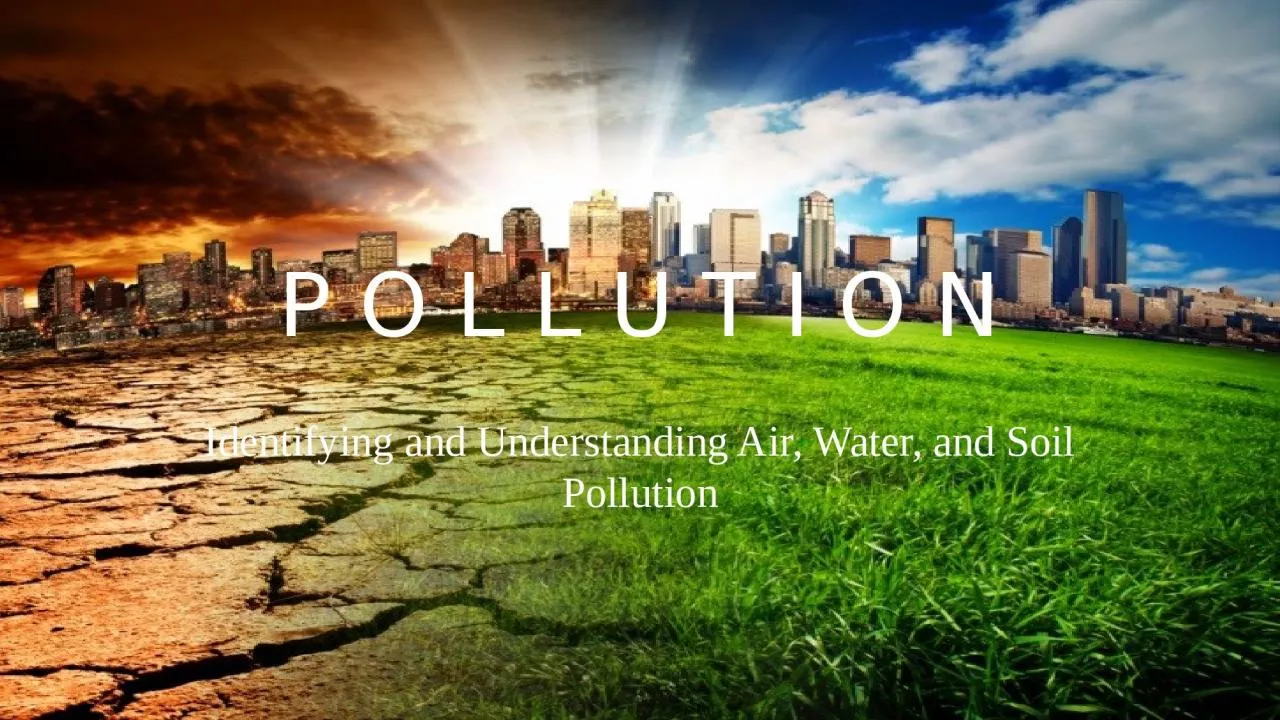
/
P O L  L  U T I O N Identifying and Understanding Air, Water, and Soil Pollution P O L  L  U T I O N Identifying and Understanding Air, Water, and Soil Pollution

P O L L U T I O N Identifying and Understanding Air, Water, and Soil Pollution - PowerPoint Presentation

jacey
jacey . @jacey
Follow
65 views
Uploaded On 2023-10-04

P O L L U T I O N Identifying and Understanding Air, Water, and Soil Pollution - PPT Presentation

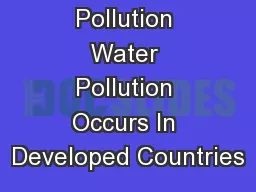
Water Pollution Causes illness and death in humans and other species and disrupts ecosystems The chief source of water pollution are agricultural activities industrial facilities and mining but growth in population and resource use make it increasingly worse ID: 1022342

oil water waste wastes water oil wastes waste sewage drinking pollution polluted 000 pollutants million groundwater chemicals epa treatment

Share:

Link:

Embed:

Download Presentation from below link

Download Presentation The PPT/PDF document "P O L L U T I O N Identifying and Unde..." is the property of its rightful owner. Permission is granted to download and print the materials on this web site for personal, non-commercial use only, and to display it on your personal computer provided you do not modify the materials and that you retain all copyright notices contained in the materials. By downloading content from our website, you accept the terms of this agreement.


Presentation Transcript

1. P O L L U T I O NIdentifying and Understanding Air, Water, and Soil Pollution

2. Water PollutionCauses illness and death in humans and other species and disrupts ecosystems.The chief source of water pollution are agricultural activities, industrial facilities, and mining, but growth in population and resource use make it increasingly worse.Lake Washington and Puget Sound are a great example of identifying pollution and then educating people to help fix the problem.3.2 million people die prematurely every year from infected water.1.2 billion people do not have access to clean drinking water.1.9 million people die of diarrhea each year

3. Type and EffectsMajor water pollutants and their SourcesExamplesMajor SourcesInfectious agents (pathogens) cause diseasesBacteria, Viruses, Protozoa, ParasitesHuman and animal wastesOxygen Demanding wastes deplete dissolved oxygen needed by aquatic speciesBiodegradable animal wastes and plant debrisSewage, animal feedlots, food processing facilities, pulp millsPlant Nutrients Cause excessive growth of algae and other species.Nitrates (NO3-) and Phosphates (PO4-)Sewage, animal wastes, inorganic fertilizersOrganic Chemicals add toxins to aquatic systemOil, gasoline, plastics, pesticides, cleaning solventsIndustry, farms, householdsInorganic Chemicals add toxins to aquatic systemAcids, bases, salts, metal compoundsIndustry, households, surface runoffSediments Disrupt photosynthesis food webs, other processesSoil, SiltLand erosionHeavy Metals cause cancer, disrupt immune and endocrine systemsLead, mercury, arsenicUnlined landfills, household chemicals, mining refuse, industrial dischargesThermal make some species vulnerable to diseaseHeatElectric power and industrial plants

4. Type of OrganismDiseases transmitted to humans through contaminated drinking waterDisease/EffectsBacteriaTyphoid Fever - Diarrhea, severe vomiting, enlarged spleen, inflamed intestine, often fatal if untreatedCholera – Diarrhea, severe vomiting, dehydration; often fatal if untreatedBacterial Dysentery – Diarrhea, bleeding; rarely fatal except in infants without proper treatmentEnteritis – Severe stomach pain, nausea, vomiting, rarely fatalVirusesInfectious Hepatitis (Type B) – Fever, severe headache, loss of appetite, abdominal pain, jaundice, enlarged lever; rarely fatal, but may cause permanent liver damage.Poliomyelitis – Fever, diarrhea, backache, sore throat, aches in limbs; can infect spinal chord and cause paralysis and muscle weaknessParasitic ProtozoaAmoebic dysentery – Severe diarrhea, headache, abdominal pain, chills, fever; if not treated can cause liver abscess, bowel perforation, and deathGiardiasis – Diarrhea, abdominal cramps, flatulence, belching, fatigueCryptosporidum – Severe diarrhea, cramps for up to 3 weeks, and possible death for people with weakened immune systemParasitic WormsSchistosomiasis – Abdominal pain, skin rash, anemia, chronic fatigue, and chronic general ill healthAncylostomiasis – Severe anemia and possible symptoms of bronchial infection

5. Testing Water for PollutantsEscherichia coli (E. coli) – lives in the colons of humans and other animals and is present in fecal waste. Most coliform bacteria do not cause disease but E. coli O157:H7 is pathogenic and very dangerous.Presence of coliforms in water indicates exposure to human or animal wastes that are likely to contain disease causing agents.To be safe for drinking 100 mL of water should contain no colonies of coliform bacteria. To be safe for swimming 100 mL of water should contain no more than 200 colonies of coliform bacteria. By contrast a raw sewage sample may contain several million coliform bacteria colonies.

6. Testing Water for PollutantsDissolved Oxygen (DO) – measured in ppm (parts per million). 1 ppm is equivalent to 1 mg/L or 1 mg/kg of water or soil respectively.Excessive inputs of oxygen-demanding wastes can deplete DO levels.DO values for water quality at 20◦ C.Good – 8 to 9 ppmSlightly Polluted – 6.7 to 8 ppmModerately Polluted – 4.5 – 6.7 ppmHeavily Polluted – 4 to 4.5 ppmGravely Polluted – below 4 ppm

7. Testing Water for PollutantsChemical Analysis – identify specific organic/inorganic chemicals in polluted water.Organic chemicals:VOC’s and PCB’sPharmaceutical drugsDetergentsPetroleum ProductsInorganicAcidity (pH/alkalinity)AmmoniaHeavy Metals (Pb, Hg etc.)Sediment ( turbidity, conductivity)Fertilizers (nitrates and phosphates)

8. Testing Water for PollutantsIndicator Species – use of cattails and other aquatic plants from polluted water areas and analyze toxins found in tissues. Use of benthic species such as mussels.Amphibians and Dragonflies are great indicator species due to their amphibious lifestyles.Genetic engineers are working to develop bacteria and yeast that glow in the presence of specific pollutants.

9. Testing Water for PollutantsWater Quality ParametersTemperature, pH, DO, Conductivity, Turbidity, Chlorophyll-A, Stream Flow, Total solids, alkalinity, fecal coliform, phosphates and nitratesThese parameters are mainly for surface water monitoring.Agencies and volunteers can utilize test kits to monitor these parameters.These parameters provide crucial data for developing conservation and pollution remediation efforts.

10. Major Water Pollution Problems inStreams and lakesStreams can recover rapidly from moderate levels of degradable, oxygen-demanding wastes through dilution and biodegradation.This natural process will not occur when streams are overloaded with pollutants, dammed up, or flow is reduced.This process cannot remove slowly degradable and nondegradable pollutants.The breakdown of biodegradable wastes by bacteria depletes DO and creates an oxygen sag curve.BOD – Biochemical Oxygen Demand; the amount of DO required by aerobic biological organisms to break down organic material in a given water sample at a certain temperature over a specific time.

11.

12. Stream PollutionDeveloped vs Developing CountriesDevelopedLegislation (US) (Clean Water Act 1972)Set standards for wastewater from industryUse of waste water treatment plantsClean up of Cuyahoga River in OhioClean up of Thames River in EnglandDevelopingHalf of the world’s 500 rivers are heavily polluted.Cannot afford wastewater treatmentLack proper legislation80-90% of untreated sewage discharged directly into rivers is then used for drinking, bathing, and washing clothesMore than 2/3 of India’s water sources are polluted with industrial waste and sewage.1/3 of the monitored rivers in China are judged unfit for agricultural and industrial use.

13. India’s Ganges RiverGanges is considered a Holy RiverHindu culture believes in cremation and disposing of the ashes into the river to allow the soul to get to heaven.Large quantities of wood are used for cremations causing air pollution and deforestation.The river is polluted with human corpses because many people cannot afford cremations and dispose of unburned and partially burned corpses.The river is polluted with livestock carcasses as wellPeople bathe, drink, and take dips for religious reasonsAnother religious custom involves throwing vividly painted statues into the river. These paints often have toxic metals and potentially harmful organic compounds in them.

14. Lake and Reservoir PollutionLakes and reservoir are less effective at diluting pollutants than streams because they have stratified layers and have little to no flow.The flushing and changing of water in lakes and reservoirs can take 1 to 100 years, compared to several days or weeks for a stream.They are more vulnerable to contamination by runoff pollutants and nondegradable toxic substances like lead, mercury, and selenium.These contaminants kill benthic life, fish, and birds that feed on contaminated aquatic organsims.Many toxic chemicals and acids enter lakes and reservoirs from the atmosphere.

15. Eutrophication

16.

17. Groundwater and Drinking water PollutionGroundwater cannot clean itself very well.95% of drinking water in the rural US comes from groundwater.Common pollutants are fertilizers, pesticides, gasoline, and organic solvents.People who dump or spill fuel and solvents also pollute groundwater.Once groundwater becomes contaminated it becomes difficult and costly to remediate because the pollutants become embedded in the porous layers of sand, rock, and gravel.The slow moving groundwater disperses the pollutant in a widening plume of contamination. This prevents dilution and the cold temperature of the water reduces chemical reactions that decompose waste.Takes decades to thousands of years to cleanse groundwater of slowly degradable and nondegradable wastes.

18. Groundwater Pollution is a Serious ThreatUS EPA survery of 26,000 industrial waste lagoons revealed 1/3 of them did not have a protective liner.Almost 2/3 of America’s liquid hazardous wastes are injected into deep disposal wells underground.By 2006, EPA completed the cleanup of 350,000 of more than 460,000 underground tanks in the US.Determining the extent of a leak can cost $25,000 – 250,000 and clean up can cost $10,000 – more than 250,000.MTBE (Methyl Tertiary Butyl Ether), a gas additive used since 1979 is another major threat to groundwater sources. By the time this was discovered, more than 250,000 leaking tanks had contaminated aquifers.

19.

20. Arsenic ContaminationSoils and Rocks naturally contain arsenic.Mining and Ore Processing can release arsenic into drinking water.Accepted safe drinking standards are 10 ppb (parts per billion).2007 WHO study found that more than 140 million people in 70 countries are drinking water with arsenic concentrations 5-100 times that level.Bangladesh, China, and West Bengal (state in India) suffer from high levels of arsenic.Exposure can cause skin, bladder, and lung cancer. (Chile had 3-14 times higher than normal rates)Many EPA scientists want to lower the standard to 3-5 ppb due to the cancer rate being 30 times higher than any other carcinogen regulated by the EPA.Rice University in Houston, Texas had a break through in 2006 for a relatively cheap means to treat water for arsenic using a rust powder in nanocrystal form.

21. Pollution Prevention is the only effective way to protect Groundwater.PreventionFind substitutes for toxic chemicals.Keep toxic chemicals out of the environment.Install monitoring wells near landfills and underground tanksRequire leak detectors on underground tanksBan hazardous waste disposal in landfills and injection wellsStore harmful liquids in aboveground tanks with leak detection and collection systems.CleanupPump to surface,clean, and return to aquifer (very expensive)Inject microorganisms to clean up contamination (less expensive but still costly)Pump nanoparticles of inorganic compounds to remove pollutants (still being developed)

22. Purifying Drinking WaterUse of reservoirs and purification plantsProtecting Watersheds (New York saved billions by restoration)Processing sewer water into drinking water (El Paso, Texas – 40%)Fill plastic bottles with water and expose to intense sunlight can kill microbes in as little as 3 hours. Paint one side black to improve solar disinfection.Use of nanofilters to clean contaminated water. (Life Straw)

23. Laws to Protect Drinking Water QualityClean Water Act of 1972 set wastewater standards for industryClean Drinking water Act of 1974 established maximum contaminant levels.UN estimates 5.6 million Americans drink water that does not meet EPA standards.Health scientist want to connect smaller treatment stations with larger ones and ban lead in all faucets, plumbing pipes, and fixtures.Water-polluting industries petition for exemptions from following EPA regulations due to expensive technologies.

24. Bottle WaterBetween 1976 and 2006 bottled water consumption increased from 2 gallons to 30 gallons a year.Bottled water costs 240- 100,000 times more than tap water.Studies indicate that ¼ of it is tap water in a bottle, and that 40% of it is contaminated with bacteria and fungi.Government testing standards for bottled water are not as high as they are for tap water.Consumers spend $100 billion on bottled water (US 1-2 billion)Plastic water bottles pollute the earth enough to circle the equator 8 times end to end.Pollution of air from manufacturing water bottles and shipping them is extensive.The oil used to produce 30 billion water bottles used in the US could fuel 100,000 cars for a year.The energy used to pump, process, transport and refrigerate the water would be enough to run 3 million cars for a year.

25. Ocean PollutionCoastal areas bear the brunt of inputs of pollutants and waste.40% of world’s population lives on or near the coast.53% of US population lives on or near the coast.80-90% of municipal sewage from developing countries is dumped into the oceans untreated.Of the world’s 15 largest metropolitan areas, 14 are near coastal waters.Cruise ships pollute heavilyIn 2005 EPA classified four of five estuaries as threatened or impairedRunoffs of sewage and agricultural wastes introduce large quantities of phosphates and nitrates which cause harmful alga blooms (red tide)Harmful algal blooms cause oxygen-depleted zones. (Gulf of Mexico)Ocean oil (crude and refined petroleum) from tankers and offshore drilling rigs37% -and perhaps even half – of the oil reaching the oceans is waste oil, dumped, spilled, or leaked onto land or into sewers.Have reduced incidents from tanker accidents by 75% and oil discharges from industry and cities by 90%

26. Ocean Oil and WildlifeVolatile organic hydrocarbons in oil immediately kill many aquatic organisms, especially in their vulnerable larval forms.Tar-like globs that float on the surface can coat feathers and fur destroying animals buoyancy and insulation.Heavy oil components that sink to the ocean floor or wash into estuaries can smother bottom-dwelling organisms, or make them unfit for consumption.Some oil spills have killed coral reefs and fish populationsResearch shows that ecosystems can recover from crude oil spills in about 3 years, but exposure to refined oil can take up to 10-20 years, especially in estuaries and salt marshesScientists estimate that current cleanup methods can only recover approximately 15% of the oil from a major spill.Prevention of oil pollution is the most effective and least costly approach

27.

28. Coastal Water PollutionSolutionsPreventionReduce input of toxic pollutantsSeparate sewage and storm linesBan dumping of wastes and sewage by ships in coastal watersBan ocean dumping of sludge and hazardous dredged material.Regulate coastal development, oil drilling, and oil shipping.Require double hulls for oil tankersCleanupImprove oil spill clean-up capabilities.Use nanoparticles on sewage and oil spills to dissolve the oil or sewage (still under development)Require Secondary treatment of coastal sewageUse wetlands, solar-aquatic or other methods to treat sewage.

29. Reducing Water PollutionReduce surface water from nonpoint sourcesFarmers keeping fields covered vegetation.Organic farming opposed to fertilizer farming.If fertilizer farming use slow release fertilizers.Use buffer zones of vegetation and keeping feedlots and animal wastes sites away from water sources.Applying pesticides only when needed and relying more on integrated pest management plans.Tougher pollution control regulations for US livestock operations

30. Reducing Point Source PollutionClean Water Act 1972 led to significant improvements.Between 1992 and 2002 community water systems that met health standards improved from 79% to 94%.The percentage of US stream lengths found to be fishable and swimmable increased from 36% to 60%.The amount of topsoil lost to agricultural run off was reduced by 1.1 billion metric tons (1 billion tons).The US population served by sewer water treatment increased from 32% to 74%.Annual wetland losses decreased by 80%.But. . .In 2006 EPA found 45% of the countries lakes and 40% of the countries streams were still too polluted for swimming and fishing and that run off of animal wastes pollutes 7 of every 10 US rivers.

31. Sewage Treatment Reduces Water PollutionSewage treatment prevents some but not all wastes from going down stream.There are three steps:Primary – physical removal of waste (screens and settling out)Secondary – biological removal of waste (microbes)Tertiary – specialized physical and chemical removal of waste (special filters)

32.

33. Village Creek Water Reclamation FacilityFort Worth’s waste water treatment facilityInfluent Flow = 100 million gallonsScreenings = 13 cubic yardsEffluent = 94 million gallonsReclaim water flow = 6 million gallonsLand applied biosolids = 80 dry tonsPower generated = 5 MWPower saved by heat recovery = 1.5 MWPower purchased = 2 MW

34. COLLECTION SYSTEMCollect waste and transport to treatment planSCREENSTrash removedPRIMARY CLARIFIERSolids settle by gravityAERATION BASINOrganic material consumed by bacteriaSECONDARY CLARIFIERSolids settle by gravityFILTERSRemaining solids filtered outDISINFECTIONPathogens destroyed by chlorinationDECHLORINATIONRemaining chlorine removed by sulfur dioxideDISCHARGEEffluent release to Trinity RiverRECLAMATIONReused for irrigation and cooling waterANAEROBIC DIGESTERSolids stabilized by bacteriaGAS TURBINESBiogas used to run turbinesDEWATERINGExcess water removed from sludgeLAND APPLICATIONBiosolids distributed on ranch landPOWER GENERATIONElectricity produced by generatorHEAT RECOVERYHeat digesters, building, run steam engine

35. The Composting ToiletLess materials and fewer pipes.No water to very low water use.Breakdown human waste into useful fertilizers that are pathogen free.Oxygen, moisture, and heat are key to keeping an odor free operation.How can this device help to prevent water pollution?

36. Treating Sewage by Working with Nature

37. Solutions to Water PollutionPrevent groundwater contaminationReduce nonpoint runoffReuse treated wastewater for irrigationFind substitutes for toxic pollutantsWork with nature to treat sewagePractice the three R’s of resource (reduce, reuse, recycle)Reduce Air PollutionReduce PovertySlow population growth

38. What YOU can do to reduce Water PollutionFertilize garden and yard plants with manure or compost instead of commercial or inorganic fertilizers.Minimize your use of pesticides, especially near bodies of water.Prevent yard wastes from entering storm drains.Do not use water fresheners in toiletsDo not flush unwanted medicines down the toiletDo not pour pesticides, paints, solvents, oil, antifreeze, or other products containing harmful chemicals down the drain or onto the ground.