/
Biomarkers of Cigarette Smoking Biomarkers of Cigarette Smoking

Biomarkers of Cigarette Smoking - PDF document

jade
jade . @jade
Follow
345 views
Uploaded On 2022-08-25

Biomarkers of Cigarette Smoking - PPT Presentation

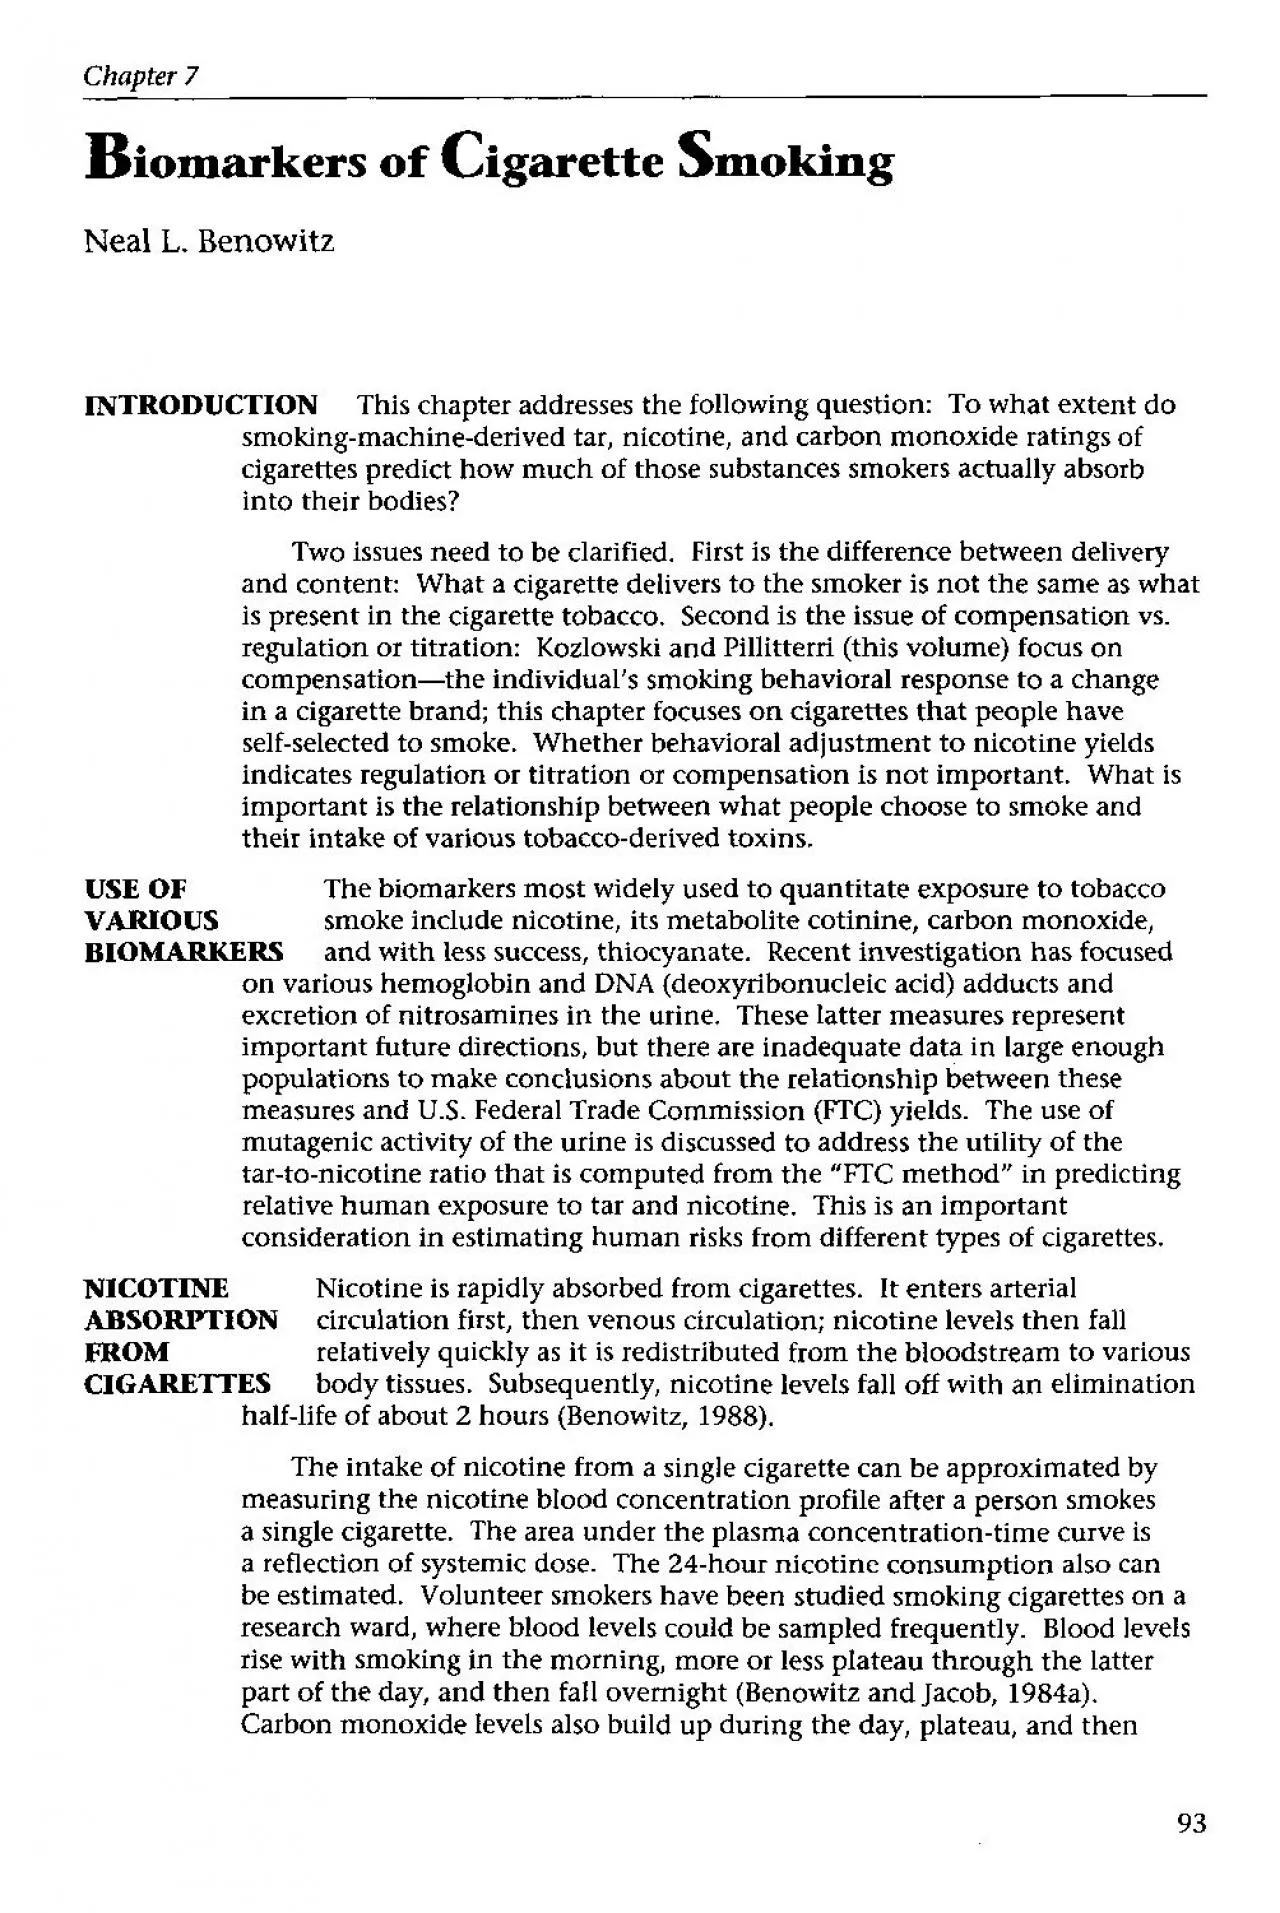
Chapter 7 Neal L Benowitz what extent smokingmachinederived tar nicotine carbon monoxide cigarettes predict how much substances smokers actually absorb into their bodies Two issues need to ID: 941509

cigarettes nicotine yield smoking nicotine cigarettes smoking yield intake cigarette benowitz ftc smokers cotinine concentration chapter tar blood people

Share:

Link:

Embed:

Download Presentation from below link

Download Pdf The PPT/PDF document "Biomarkers of Cigarette Smoking" is the property of its rightful owner. Permission is granted to download and print the materials on this web site for personal, non-commercial use only, and to display it on your personal computer provided you do not modify the materials and that you retain all copyright notices contained in the materials. By downloading content from our website, you accept the terms of this agreement.


Presentation Transcript

Chapter 7 Biomarkers of Cigarette Smoking Neal L. Benowitz what extent smoking-machine-derived tar, nicotine, carbon monoxide cigarettes predict how much substances smokers actually absorb into their bodies? Two issues need to self-selected to smoke. Whether behavioral adjustment to nicotine yields indicates regulation people choose various tobacco-derived USE OF The biomarkers most widely rapidly absorbed circulation first, FROM relatively quickly as it is redistributed from the bloodstream to various levels fall research ward, rise with smoking in the morning, more or less platea

u through the latter Jacob, 1984a). also build day, plateau, 93 Chapter 7 approximately 16-hour relatively small circadian variation, cotinine can be representative of the average daily cotinine level. is possible, measuring all 90 percent estimating nicotine urine and sum steady state metabolism are this sum 24-hour urine each day. NICOTINE CONTENT As noted earlier, cigarette content is not the same as cigarette 1983 study FK YIELD (Benowitz et al., 1983b) that investigated the nicotine content of tobacco. The nicotine concentration of tobacco averaged 1.6 percent. in the rod

and the FTC-predicted nicotine yield. There was a significant inverse relationship between the concentration of nicotine and the FTC nicotine yield. Thus, the yield as measured by smoking machine gives no information about the content tobacco. The nicotine in tobacco simply nicotine dose. The about the amount of nicotine that could be obtained from the tobacco if person smoked optimize intake. four general NICOTINE INTAKE from tobacco: In circadian fashion, measure blood during cigarette smoking 1984a and 1984b). If the of nicotine also is measured by intravenous infusion nicotine, blood

smoking can daily dose can be with blood person has smoked (Benowitz et al., 1991). (3) Blood cotinine levels during ad libitum cigarette smoking have been used widely intake, which discussed below. (4) Finally, as mentioned Byrd and colleagues (1995), libitum smoking estimate nicotine intake. be used how much nicotine being taken from smoking. cigarette from The first measuring blood steady state 1984a, 1984b, 1985). The dose 1.60 mg 95 Chapter 7 Table 1 nicotine from smoking studies Systemic Dose (mghigarette) Standard Method N Average Deviation Range Reference 1 22 1

.04 0.36 0.37-1.60 Benowitz and Jacob, 1984a 11 1.oo 0.1 5 0.87-1.48 Benowitz and Jacob, 1984b 11 0.90 0.1 5 - Benowitz and Jacob, 1985 2 10 2.29 1.oo 0.37-3.47 Benowitz et al., 1991 3 20 0.87 0.41 0.22-1.92 Benowitz and Jacob, 1994 the smokers’ anticipation of no more cigarettes becoming available that day. finding illustrates nicotine intake anticipated need, nicotine. The intake in this from ad libitum daily smoking. Consistent with which subjects tripled cigarettes allowed smoked per day was limited et al., 1986a). measuring blood in an estimated dose cigar

ette, with Jacob, 1994). What quantitative relationship between nicotine intake data from volunteer whose plasma levels were research ward correlation between study-measured intake it represents most smokers nicotine than predicted from the FTC yield. People who smoked low-yield cigarettes took more nicotine when people smoked cigarettes a nominal or higher undersmoking those cigarettes behavior might explain change in may affect 97 Chapter 7 to a typical smoker with a 24 mg per day. Based on average cigarette consumption, that represents an factor did vary as whether a or no

nsmoker, gender. Thus, cotinine concentration. a study smoking cessation program are shown in Figure 4 (Benowitz et al., 1983b). There was a weak relationship between FTC yield and cotinine level. The slope of this relationship was and, in this yield of cigarettes, there was only a 5-to 10-percent change in cotinine level, 10-percent change nicotine intake. correlation between and cotinine (or nicotine intake). Thus, some studies, such colleagues (1992), strong relationship Figure 4 Afternoon blood cotinine concentrations with the day (Panel A) and the FTC-determined nicotine (Panel

B) 1,000 I B  n = 136 1 0 r = 0.15 NS 800  400  ) 200 0  0 10 20 30 40 50 60 70 80 90 10 0 0.2 0.4 0.6 0.8 1.0 1.2 1.4 1.6 1.8 2.0 Cigarettes per Note: These because data incomplete. Morning similar correlations with of cigarettes (r = 0.45) and the FTC yield (r = 0.06). Key: NS = not significant; 0 = 1 observation;0 = 2 observations; A = 3 observations;0 = 4 observations. Benowitz et 99 Chapter 7 ultralow cigarette another study smokers of cigarettes of different yields compared by category of FTC nicotine high-yield category very low the ultralow was less tha

n 0.20 mg nicotine per cigarette by FTC method. Figure 6 carbon monoxide, thiocyanate, blood nicotine, habitual smokers cigarettes according 40 u)  Q)* zm 35- - b]I [I 051  .F 30 --30 0 25 --25 Q) 30 - -30 u CUn 2 0.2 E - 0 *ze 0 a 25 -25 rq4 20 --20 Q) - 175 51 - 150 cg 150 /-- .P 5 125 -125 20 - -20 .-ET 5E 00) 15- zs 10 - $1:: - 350 .-ET -300 .E E 250 -250 50 200 200  0.5 Ij_l ! 150 150 I  0.20-0.59 0.60-0.99 1:: ";;  101  Chapter 7 Table 2 nicotine intake machine nicotine Nicotine Study Population Yields (mg) Results Ric

kert and Robinson, 84 during routine medical exams 0.25-1.3 vs. Mach-N Russell et ai., 1980 from smokers’ 0.5-3.5 vs. Mach-N Benowitz et al., 1983b seeking smoking cessation therapy r = 0.15 (n = 137) r = 0.06 (n = 123) BCOT VS. FfC-N Ebert et al., 1983 76-mix of smoking cessation, hospital employees, ambulatory patients 0.1-1.5 r = 0.2!ja PNIC VS. FTC-N Gori and Lynch, 1985 from shopping 0.1-1.6 PNlC VS. FTC-N r = 0.37a r = 0.23a PCOT VS. FTC-N Benowitz et al., 1986b seeking smoking previous study) 0.1 -1.9 similar for Russell et al., 1986 from smokers’ - BCOT vs

. BNlC vs. Mach-N r = 0.26a Rosa et al., 1992 attending military medical center 0.38-1.38 vs. Mach-N Coultas et al., 1993 from Hispanic household survey - r = 0.12 SCOT VS. FTC-N Byrd et al., 1995 33 volunteers 0.13-1.3 Urine N + metabolites VS. FTC-N N/cig: r ~ a p 0.05. Key: PCOJ = plasma cotinine concentration; Mach-N = Smoking-machine-determined nicotine yield; PNlC = plasma nicotine concentration; nicotine concentration; cotinine concentration; 103 Chapter 7 Figure 7 carbon monoxide cigarettes smoked 6o r I I I I I I I I I 0 2 4 6 8 10 12 14 16 18 20

FTC Carbon Monoxide (mg/cigarette) broken line Source: Gori and Lynch, 1985. Figure 9 shows data from a crossover study of urine mutagenicity and nicotine intake from smoking their own brand, (True) (Benowitz was lower likely because smokers their own. values for were similar. The ratio over the 24-hour period under the nicotine plasma concentration-time curve nicotine intake) a surrogate tar-to-nicotine ratio machine-predicted ratios were 14.8 11.5 ratio did machine-determined tar-to-nicotine brands. 9 also data when switching small difference in the 105 Chapter 7 Figure 9 ac

tivity to high-low yield Group 1 Grc ,2 Ratio Mutagenic Ratio Mutagenic Activity Activity/AUC., Activity Activity/AUC,, tar/nic. ratio rev./24 hours) ( ) ( ) 12 50 T ro T 40 T T 30  OHL OHL significant difference own brand. blndicates significant difference compared high-yield cigarettes. of tar FTC testing and ultralow-yield cigarettes, ratios activiiy to nicotine exposure were not different while subjects high-, low-, indicate standard error of ratio of mutagenic activity nicotine exposure; rev revertant colonies; own brand; high-yield cigarettes (Camel); low-yield cigarette

s ultralow-yield kigarettes (Cambridge or Carlton). Source: Benowitz et a/., 1986b. Table 3 Influence of intensity of smoking on tar-to-nicotine ratio, based on smoking machine studies Standard Yield Different Smoking Group N Nicotine Standard Moderate I 4 9.2 9.9 ll.la II 10 2-5 0.2-0.5 10.3 11 .7a 1 2.2a Ill 8 5- 10 0.5-0.9 11.3 11.9 1 2.6a IV 9 10 -14 0.8-1 .O 12.7 1 3.3a 12.4 V 5 14 -17 0.9-1 .o 15.7 1 6.5a 14.7 smoking machine number of brands tested. Source: Rickert et al.. 1983. 107 Chapter 7 be limited how much not think cigarettes as a low-nicotine cigarette. DR. BOCK:

what you DR. BENOWITZ: Yes. DR. BOCK: a little difference between overcompensation and compensation. BENOWITZ: Yes, DR. HATSUKAMI: studies where you looked actual intake, studies differentiated people initiated with low-tar and low-nicotine cigarettes and those who switched? those two people? have never interesting question initiation. The from Dr. Giovino suggest that most low-yield cigarette smokers are people from higher low-yield cigarettes. It would be a good DR. DEBETHIZY: Would you say that, on average, the people who smoke lower yielding cigarettes absorb less nicotine? i

s very shallow. DR. DEBETHIZY: So, if people are smoking very low-yielding cigarettes, they are absorbing is incomplete; there is not a flat line. you pointed absorbed, on average, 1mg of nicotine from cigarettes. And I think that out that do absorb less nicotine. BENOWITZ: Yes, although it unclear where break is very, very low-yield than the most people smoke. a shallow relationship. are talking 10-percent variation yields from 0.1 to 1.6. So, there is some reduction in nicotine intake per is very small. other point out that will discuss a little later why our be unique 109 Chapt

er 7 Coultas, D.B., Stidley, C.A., Samet, J.M. Cigarette and nicotine to tobacco smoke. American Rmkw ofRespiratory Diseuse 148: 435-440,1993. Ebert, R.V., McNabb, M.E., McCusker, K.T., Snow, S.L. carbon monoxide inhaled by smokers of low-tar, low-nicotine cigarettes. the Ammican 28404842,1983. intake from Federal Trade Toxicology and Pharmacology 1983. yields as smoke bioavailability. and Pharmacology Jarvis, M., Tunstall-Pedoe, H., Feyerabend, C., Vesey, C., Salloojee, Y. Biochemical markers of smoke absorption and reported exposure of Epidemiology and 335-339, 1984. Rickert,

W.S., Robinson, J.C. Estimating the hazards of hazardous cigarettes. cigarette yields nicotine, carbon monoxide, cyanide in relation to levels of cotinine, and thiocyanate Journal of Toxicology and Environmental Health 7: 391-403, 1981. Rickert, W.S., Robinson, J.C., Young, J.C., Collishaw, N.E., Bray, D.F. A comparison of the yields of tar, carbon monoxide cigarettes tested under three conditions. Preventive Medicine 682-694, 1983. Rosa, M., Pacifici, R., Altieri, I., Pichini, S., Ottaviani, G., Zuccaro, P. How the steady-state cotinine concentration in cigarette smokers is directly

Clinical Pharmacology 324-329, 1992. M.J., Feyerabend, carbon monoxide intake in low tar smokers. Journal of Epidemiology and Community Health 40(1): 80-85, 1986. Russell, M.A.H., Jarvis, M., Iyer, R., Feyerabend, C. Relation of nicotine yield of cigarettes to blood nicotine concentrations Journal 5: 972-976,1980. Yamasaki, E., Ames, B.N. Concentration of mutagens from urine absorption with Cigarette smokers have National Academy of Sciences United States 74: 3555-3559, 1977. This research DA-02277, CA-32389, National Institutes Health. The author thanks David Greene for editorial