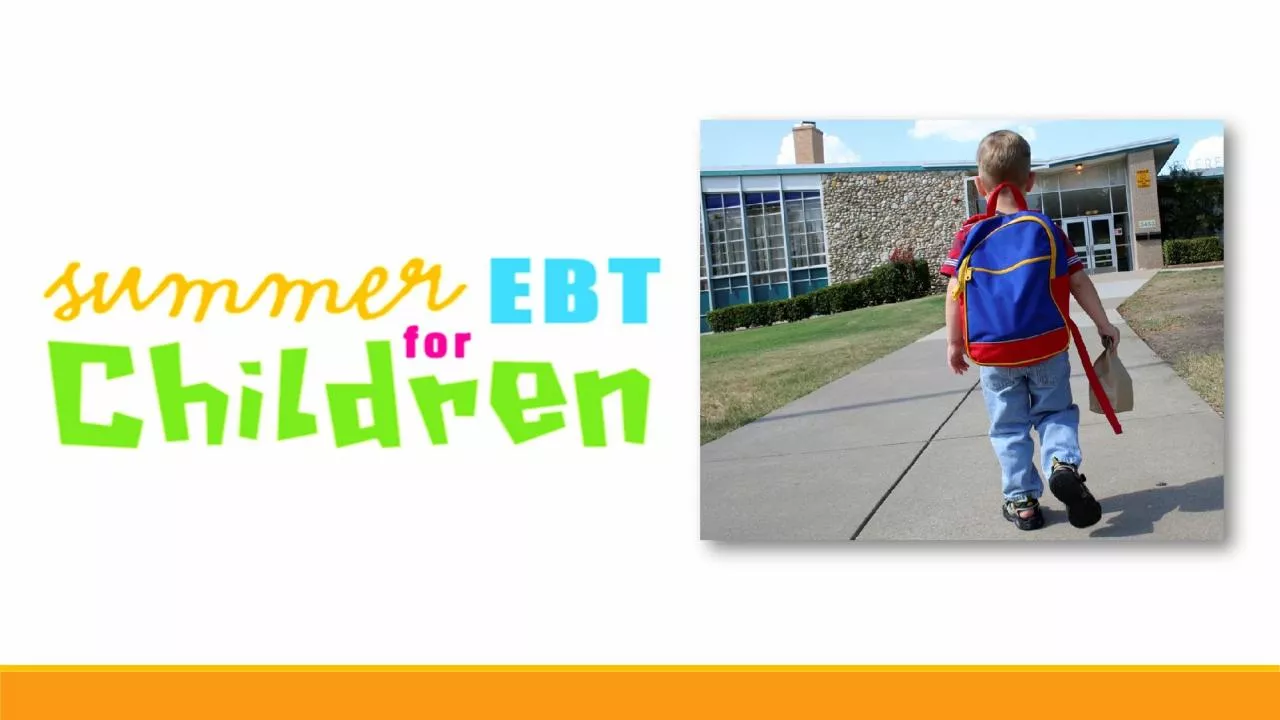
The existing Summer Meals programs reach only about 16 percent of lowincome children who get school meals during the school year Summer Feeding Programs Mission Reduce the level of summer food insecurity among children to a level ID: 920674
Download Presentation The PPT/PDF document "The Summer Hunger Gap The School Meals P..." is the property of its rightful owner. Permission is granted to download and print the materials on this web site for personal, non-commercial use only, and to display it on your personal computer provided you do not modify the materials and that you retain all copyright notices contained in the materials. By downloading content from our website, you accept the terms of this agreement.
Slide1
Slide2The Summer Hunger Gap
The School Meals Programs serve about 21 million low-income children each school day.
The
existing Summer Meals programs reach only about 16 percent of low-income children who get school meals during the school year.
Slide3Summer Feeding Programs Mission
Reduce the level of summer food insecurity among children to a level
at or below
that of childhood food insecurity during the school year.
Slide4Policy Background
2010 Agriculture Appropriations Act (P.L. 111-80) authorized and funded Summer Food for Children Demonstrations, including Enhanced Summer Food Service Program (
eSFSP
) and Summer Electronic Benefits Transfer for Children (SEBTC
)
Two Types of Demos- WIC and SNAP model
Slide5SEBTC Nationwide Background
2011
5 Sites for “Proof of Concept”
Two WIC Agencies (Michigan & Texas)
Three SNAP Agencies (Connecticut, Missouri & Oregon)
Evaluation Component: Compare measures of Food Insecurity of households receiving $60 SEBTC benefit and $0 SEBTC
benefit
2012
5 New Demonstration Sites
Three
new WIC Agencies ( Nevada, Chickasaw Nation & Cherokee Nation)Two new SNAP Agencies (Delaware & Washington) Evaluation Component: Compare measures of Food Insecurity of households receiving $60 SEBTC benefit and $0 SEBTC benefit
201310 Sites for 5 WIC Models5 SNAP ModelsEvaluation Component: Compare measures of Food Insecurity of households receiving $60 SEBTC benefit and $30 SEBTC benefit
Slide6Selected households were issued a WIC EBT card to shop at WIC-authorized food retailers to purchase prescribed healthy foods.
Slide7SEBTC in
Nevada Background
In
2012 the program served 5,306 children in approximately 3,500 households.
Served
select children in Washoe, Lyon and Douglas counties eligible for the School
Free and Reduced Lunch
program
.
Due
to attrition and people moving from the area, the program served 4,627 students in 2013. Funds were not available in 2014 to administer SEBTC.
Slide8SEBTC
can reach a significant proportion of children eligible for free and reduced-price school meals.
90% of SEBTC households used their benefits at least once.
SEBTC households redeemed an average of $250 over the summer, or about 78% of their benefits.
Slide9Finding: SEBTC reduced the most severe form of childhood hunger by a third.
It also had impressive results for all groups, including households and adults.
Both the SNAP and WIC models performed equally well.
Indicator
Treatment (%)
Control (%)
Impact (%)
Percentage Change
S.E.
Child
Very Low Food Security
6.4
9.5
-3.1***
33%
0.38
Food Insecure
36.2
44.6
-8.4***
19%
0.72HouseholdVery Low Food Security19.528.7-9.2***32%0.61Food Insecure48.557.3-8.8***15%0.74
*p<.10 **p<0.05 ***p<0.01
2012
Slide10Finding:
SEBTC children ate more healthfully.
SEBTC children ate 12.6% more fruits and vegetables.
They ate 29.6% more whole grains.
They ate 9.7% more dairy.
Servings/day
Slide11SEBTC 2015 in Nevada
Expanding from 3 counties to 10 counties
Returning households will receive the $60 food package and new households will receive a $30 food package
Three months of benefits, issued June 1
st
ending August 31
st
Slide12SEBTC 2015 in Nevada
Estimated
14,000 students will be served this summer
.
~ 10,000 new participants ($30 benefit)
~ 4,000 returning participants ($60 benefit)
Approximately $1.5 million in food benefits will be issued over the course of 3 months.
Slide13Selection of Expansion Sites
USDA Grant required expansion to rural areas
Rural
counties do not have enough summer sites to cover kids in the
county
Elko- only 3 sites serving approximately 150 meals a day but there are 3,482 students eligible
Lincoln & Lander- no summer feeding sites
Slide14SEBTC 2015 in Nevada Food Packages
$30 Food Package
3 gallons reduced fat milk
1 dozen eggs
18 ounces
b
reakfast cereal
18 ounces peanut butter
16 ounces whole grains
$8 cash value benefit for fruits & vegetables
$60 Food Package3 gallons reduced fat milk
1 dozen eggs
36
ounces breakfast cereal
18 ounces peanut butter
48
ounces whole grains
$16
cash value benefit for fruits &
vegetables
1 pound of cheese64 ounce of bottle single strengths4 can of beans18 ounces canned tuna/sardines
Slide15Questions?
Lauren M. Dalton, MPH
ldalton@health.nv.gov
775.684.3473