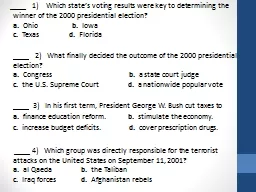
/
____   1)    Which state’s voting results were key to determining the winner of the ____   1)    Which state’s voting results were key to determining the winner of the

____ 1) Which state’s voting results were key to determining the winner of the - PowerPoint Presentation

jane-oiler
jane-oiler . @jane-oiler
Follow
349 views
Uploaded On 2018-12-06

____ 1) Which state’s voting results were key to determining the winner of the - PPT Presentation

a Ohio b Iowa c Texas d Florida 2 What finally decided the outcome of the 2000 presidential election a Congress ID: 737286

election obama iraq 2008 obama election 2008 iraq amp barack war vote republican act democratic sarah 2015 000 reform

Share:

Link:

Embed:

Download Presentation from below link

Download Presentation The PPT/PDF document "____ 1) Which state’s voting resu..." is the property of its rightful owner. Permission is granted to download and print the materials on this web site for personal, non-commercial use only, and to display it on your personal computer provided you do not modify the materials and that you retain all copyright notices contained in the materials. By downloading content from our website, you accept the terms of this agreement.


Presentation Transcript

Slide1

____ 1) Which state’s voting results were key to determining the winner of the 2000 presidential election?

a.

Ohio

b.

Iowa

c.

Texas

d.

Florida

2)

What finally decided the outcome of the 2000 presidential election?

a.

Congress

b.

a state court judge

c.

the U.S. Supreme Court

d.

a nationwide popular vote

3) In his first term, President George W. Bush cut taxes to

a.

finance education reform.

b.

stimulate the economy.

c.

increase budget deficits.

d.

cover prescription drugs.

____ 4) Which group was directly responsible for the terrorist attacks on the

United

States on

September 11

, 2001?

a.

al Qaeda

b.

the Taliban

c.

Iraq forces

d.

Afghanistan rebelsSlide2

The 21st-Century

United StatesPolitics & LeadersSlide3

The Presidency

of

Barack ObamaSlide4

Election of 2008

Democratic candidates Barack Obama and Hilary Clinton were choices but Obama was chosen as the Democratic candidate.

Obama ran against Senator John McCain for the Republican party, who chose Sarah Palin as his running mate

Hillary

Clinton & Sarah Palin

were two important women

in the 2008 electionSlide5

Election of 2008

Nominee: Barack Obama John McCain

Party: Democratic Republican

Home state: Illinois Arizona

Running mate: Joe Biden Sarah Palin

Electoral vote: 365 173

Popular vote: 69,498,516 59,948,323

Percentage: 52.9% 45.7%Slide6

Condition of US at Election

2007 US in economic recession stemming from mortgage crisis – worst since Great Depression of 1930s

Unemployment steadily climbing toward 7%

Home foreclosures grew

Sept. 2008 the stock market plunged

$700 billion bailout for banking industry abused

War in Iraq and Afghanistan (war against terrorism) still going on with more than 4,000 soldiers killed and over 31,000 woundedSlide7

Taking Office

Obama laid out ambitious agenda

:

Economic stimulus package and accountability of institutions to American taxpayers

Draw down war in Iraq & refocus military in Afghanistan

Reform nation’s healthcare insurance system

Pass new laws to regulate Wall Street

Federal government transparencySlide8
Slide9

In Office

February 2009—American Recovery and Reinvestment Act passed (stimulus package

)

March 2010--Patient Protection & Affordable Care Act

passed

July 2010--Dodd–Frank Wall Street Reform and Consumer Protection Act signed

August

2010—announced “combat mission in Iraq has ended” with increased military presence in AfghanistanMay 2011—announced the death of al Qaeda leader Osama bin Laden by US Navy SealsSlide10

Barack Obama (Democrat) 65,915,795 51.06%

Mitt Romney (Republican) 60,933,504 47.20%

Gary Johnson (Libertarian, Independent) 1,275,971 0.99%Slide11

Obama Numbers

2015

6,371,000 jobs added since 2008

Unemployment 5.1% down from high 10% Oct. 2009

Real weekly earning up 1.7%

Corporate profits have tripled

GDP up 3.7% annual rate in second quarter 2015

Consumer spending grew at a rate of 2.9% in 2nd qtr 2015 Slide12

Activity:Slide13
Slide14
Slide15