PDF-Chore Chart Chore Chore Chore Chore Chore Chore
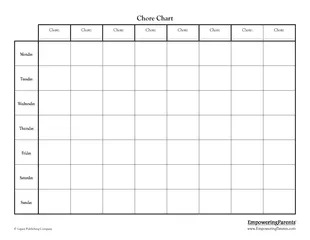
EmpoweringParentscom EmpoweringParents Help for Tough Child Behavior brPage 2br How to Use a Chore Chart Chore charts are a very helpful way to organize your childs
Download Presentation
"Chore Chart Chore Chore Chore Chore Chore Chore" is the property of its rightful owner. Permission is granted to download and print materials on this website for personal, non-commercial use only, provided you retain all copyright notices. By downloading content from our website, you accept the terms of this agreement. Download
Presentation Transcript
Transcript not available.