Column Graphs A column graph is used when we want to show a quantity and compare it to other quantities This is particularly suitable for categorical data In a column graph the ID: 716688
Download Presentation The PPT/PDF document "How to categorise phone calls" is the property of its rightful owner. Permission is granted to download and print the materials on this web site for personal, non-commercial use only, and to display it on your personal computer provided you do not modify the materials and that you retain all copyright notices contained in the materials. By downloading content from our website, you accept the terms of this agreement.
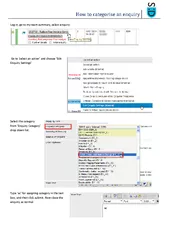
Slide1
How to categorise phone callsSlide2
Column Graphs
A
column graph is used when we want to show a quantity and compare it to other quantities. This is particularly suitable for categorical data.In a column graph, the
categories are shown on the horizontal axis and the results are shown on the vertical axis. The columns are then drawn vertically. These axes are reversed for a bar graph.Slide3
Radar Graphs
A
radar chart
is similar to a spiders web. It is particularly suitable for showing data trends that repeat.The ‘radar’ is drawn with the data being measured placed in equal sectors around the circle and the results having a scale emanating from the centre. The points are
then plotted and joined.
Today we will use Excel to create column and radar graphsSlide4
Example
The table shows the place of birth of immigrants to Australia from English-speaking countries.
Country
Males
Females
Canada
11 600
12 500
Ireland
27 000
25 400
New Zealand
139 900
135 900
South Africa
24 300
25 300
United Kingdom
560 700
557 900
USA
26 300
24 300Slide5
a. Add 2 columns to the table and write each number of immigrants (male and female) as a number in scientific notation correct to 1 decimal place
Country
Males
Females
Scientific
Notation
Canada
11 600
12 500
__._
Ireland
27 000
25 400
New Zealand
139 900135 900South Africa24 30025 300United Kingdom560 700557 900USA26 30024 300
Country
Males
Females
Scientific
Notation
Canada
11 600
12 500
Ireland
27 000
25 400
New Zealand
139 900
135 900
South Africa
24 300
25 300
United Kingdom
560 700
557 900
USA
26 300
24 300Slide6
b. Draw a column graph displaying this information. Start at zero on the vertical axis and use the scale of thousands of immigrants.
c. Redraw the column graph starting at 10 000 immigrants on the vertical axis instead of zero. How do the two graphs compare?Slide7
Complete the following questions
of
Exercise 14J:
Q1 a, b, cQ2 a, bQ3 a, b, cQ4 (optional – have a go)