/
LCE Points Statistics for  nominal points score without re ference to eligibility Best LCE Points Statistics for  nominal points score without re ference to eligibility Best

LCE Points Statistics for nominal points score without re ference to eligibility Best - PDF document

jane-oiler
jane-oiler . @jane-oiler
Follow
549 views
Uploaded On 2014-12-13

LCE Points Statistics for nominal points score without re ference to eligibility Best - PPT Presentation

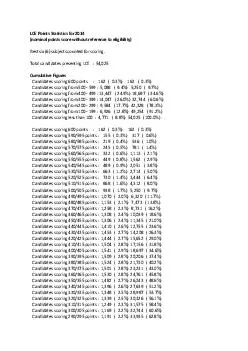
otal candidates presenting LCE 54025 Cumulative Figures Candidates scoring 600 points 162 03 162 03 Candidates scoring from 500 599 5088 94 5250 97 Candidates scoring from 400 499 13447 249 18697 346 Candidates scoring from 300 399 14047 ID: 23125

otal candidates presenting LCE

Share:

Link:

Embed:

Download Presentation from below link

Download Pdf The PPT/PDF document "LCE Points Statistics for nominal point..." is the property of its rightful owner. Permission is granted to download and print the materials on this web site for personal, non-commercial use only, and to display it on your personal computer provided you do not modify the materials and that you retain all copyright notices contained in the materials. By downloading content from our website, you accept the terms of this agreement.


Presentation Transcript

LCE Points Statistics for 2014 (nominal points score without re ference to eligibility) Best six (6) subjects counted for scoring. T otal candidates presenting LCE : 54,025 Cumulative Figures Candidates scoring 600 points : 162 ( 0.3%) 162 ( 0.3%) Candidates scoring from 500 - 599 : 5,088 ( 9.4%) 5,250 ( 9.7%) Candidates scoring from 400 - 499 : 13,447 ( 24.9%) 18,697 ( 34.6%) Candidates scoring from 300 - 399 : 14,047 ( 26.0%) 32,744 ( 60.6%) Candidates scoring from 200 - 299 : 9,584 ( 17.7%) 42,328 ( 78.3%) Candidates scoring from 100 - 199 : 6,926 ( 12.8%) 49,254 ( 91.2%) Candidates scoring less than 100 : 4,771 ( 8.8%) 54,025 (100.0%) Candidates scoring 600 points : 162 ( 0 .3%) 162 ( 0.3%) Candidates scoring 590/595 points : 155 ( 0.3%) 317 ( 0.6%) Candidates scoring 580/585 points : 219 ( 0.4%) 536 ( 1.0%) Candidates scoring 570/575 points : 245 ( 0.5%) 781 ( 1.4%) Candi dates scoring 560/565 points : 332 ( 0.6%) 1,113 ( 2.1%) Candidates scoring 550/555 points : 449 ( 0.8%) 1,562 ( 2.9%) Candidates scoring 540/545 points : 489 ( 0.9%) 2,051 ( 3.8%) Candidates scoring 530/535 points : 663 ( 1.2%) 2,714 ( 5.0%) Candidates scoring 520/525 points : 730 ( 1.4%) 3,444 ( 6.4%) Candidates scoring 510/515 points : 868 ( 1.6%) 4,312 ( 8.0%) Candidates scoring 500/505 po ints : 938 ( 1.7%) 5,250 ( 9.7%) Candidates scoring 490/495 points : 1,070 ( 2.0%) 6,320 ( 11.7%) Candidates scoring 480/485 points : 1,153 ( 2.1%) 7,473 ( 13.8%) Candidates scoring 470/475 points : 1,258 ( 2.3%) 8,73 1 ( 16.2%) Candidates scoring 460/465 points : 1,308 ( 2.4%) 10,039 ( 18.6%) Candidates scoring 450/455 points : 1,306 ( 2.4%) 11,345 ( 21.0%) Candidates scoring 440/445 points : 1,410 ( 2.6%) 12,755 ( 23.6%) Candidates scori ng 430/435 points : 1,453 ( 2.7%) 14,208 ( 26.3%) Candidates scoring 420/425 points : 1,444 ( 2.7%) 15,652 ( 29.0%) Candidates scoring 410/415 points : 1,504 ( 2.8%) 17,156 ( 31.8%) Candidates scoring 400/405 points : 1,541 ( 2.9%) 18,697 ( 34.6%) Candidates scoring 390/395 points : 1,509 ( 2.8%) 20,206 ( 37.4%) Candidates scoring 380/385 points : 1,524 ( 2.8%) 21,730 ( 40.2%) Candidates scoring 370/375 points : 1,501 ( 2.8%) 23,231 ( 43.0%) Can didates scoring 360/365 points : 1,530 ( 2.8%) 24,761 ( 45.8%) Candidates scoring 350/355 points : 1,482 ( 2.7%) 26,243 ( 48.6%) Candidates scoring 340/345 points : 1,396 ( 2.6%) 27,639 ( 51.2%) Candidates scoring 330/335 points : 1,348 ( 2.5%) 28,987 ( 53.7%) Candidates scoring 320/325 points : 1,339 ( 2.5%) 30,326 ( 56.1%) Candidates scoring 310/315 points : 1,249 ( 2.3%) 31,575 ( 58.4%) Candidates scoring 300/305 points : 1,169 ( 2.2%) 32,744 ( 60.6%) Candidates scoring 290/295 points : 1,191 ( 2.2%) 33,935 ( 62.8%) Candidates scoring 280/285 points : 1,085 ( 2.0%) 35,020 ( 64.8%) Candidates scoring 270/275 points : 1,061 ( 2.0%) 36,081 ( 66.8%) Candidates scoring 26 0/265 points : 1,056 ( 2.0%) 37,137 ( 68.7%) Candidates scoring 250/255 points : 906 ( 1.7%) 38,043 ( 70.4%) Candidates scoring 240/245 points : 891 ( 1.6%) 38,934 ( 72.1%) Candidates scoring 230/235 points : 884 ( 1.6%) 39,818 ( 73.7%) Candidates scoring 220/225 points : 889 ( 1.6%) 40,707 ( 75.3%) Candidates scoring 210/215 points : 850 ( 1.6%) 41,557 ( 76.9%) Candidates scoring 200/205 po ints : 771 ( 1.4%) 42,328 ( 78.3%) Candidates scoring 190/195 points : 845 ( 1.6%) 43,173 ( 79.9%) Candidates scoring 180/185 points : 797 ( 1.5%) 43,970 ( 81.4%) Candidates scoring 170/175 points : 781 ( 1.4%) 44,75 1 ( 82.8%) Candidates scoring 160/165 points : 755 ( 1.4%) 45,506 ( 84.2%) Candidates scoring 150/155 points : 709 ( 1.3%) 46,215 ( 85.5%) Candidates scoring 140/145 points : 621 ( 1.1%) 46,836 ( 86.7%) Candidates scori ng 130/135 points : 657 ( 1.2%) 47,493 ( 87.9%) Candidates scoring 120/125 points : 605 ( 1.1%) 48,098 ( 89.0%) Candidates scoring 110/115 points : 575 ( 1.1%) 48,673 ( 90.1%) Candidates scoring 100/105 points : 581 ( 1.1%) 49,254 ( 91.2%) Candidates scoring 100 points : 4,771 ( 8.8%) 54,025 (100.0%)