/
The Spectroscope Lab The Spectroscope Lab

The Spectroscope Lab - PowerPoint Presentation

jane-oiler
jane-oiler . @jane-oiler
Follow
374 views
Uploaded On 2016-07-17

The Spectroscope Lab - PPT Presentation

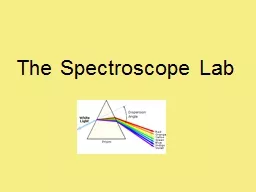
Units 1 nanometer 10 9 meters Different wavelengths correspond to different colors If you pass white light through a prism it separates into its component colors R ID: 408500

spectral lines gas colors lines spectral colors gas hot spectrum wavelengths produces dark line emission density rainbow absorption dense

Share:

Link:

Embed:

Download Presentation from below link

Download Presentation The PPT/PDF document "The Spectroscope Lab" is the property of its rightful owner. Permission is granted to download and print the materials on this web site for personal, non-commercial use only, and to display it on your personal computer provided you do not modify the materials and that you retain all copyright notices contained in the materials. By downloading content from our website, you accept the terms of this agreement.


Presentation Transcript

Slide1

The Spectroscope LabSlide2

Units: 1 nanometer= 10

-9

meters!

Different

wavelengths

correspond

to

different

colors!Slide3

If you pass white light through a prism, it separates into its component colors.

R

.

O

.

Y

.

G. B.I.V !!

long wavelengths

short wavelengths

SpectrumSlide4

A hot object or a hot, dense gas produces a

continuous spectrum

-- a complete rainbow of colors without any specific spectral lines. Slide5

A hot, low density gas produces an

emission line spectrum

- a series of bright spectral lines against a dark background.Slide6

A cooler, low density gas in front of a hot dense gas produces an

absorption line spectrum

- a series of dark spectral lines among the colors of the rainbow.Slide7
Slide8

Spectral Lines

By observing the location of the emission and or the

absorption lines, one can identify the element!!!!