PPT-Decadal trends in US OMI NO
Author : joedanone | Published Date : 2020-06-29
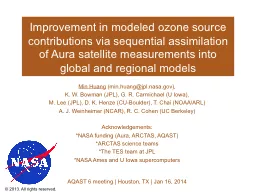
2 observations and the role of the upper troposphere Rachel Silvern Atmospheric Chemistry Modeling Group Harvard University TEMPO Science Team Meeting June 7 2018
Presentation Embed Code
Download Presentation
Download Presentation The PPT/PDF document "Decadal trends in US OMI NO" is the property of its rightful owner. Permission is granted to download and print the materials on this website for personal, non-commercial use only, and to display it on your personal computer provided you do not modify the materials and that you retain all copyright notices contained in the materials. By downloading content from our website, you accept the terms of this agreement.
Decadal trends in US OMI NO: Transcript
Download Rules Of Document
"Decadal trends in US OMI NO"The content belongs to its owner. You may download and print it for personal use, without modification, and keep all copyright notices. By downloading, you agree to these terms.
Related Documents