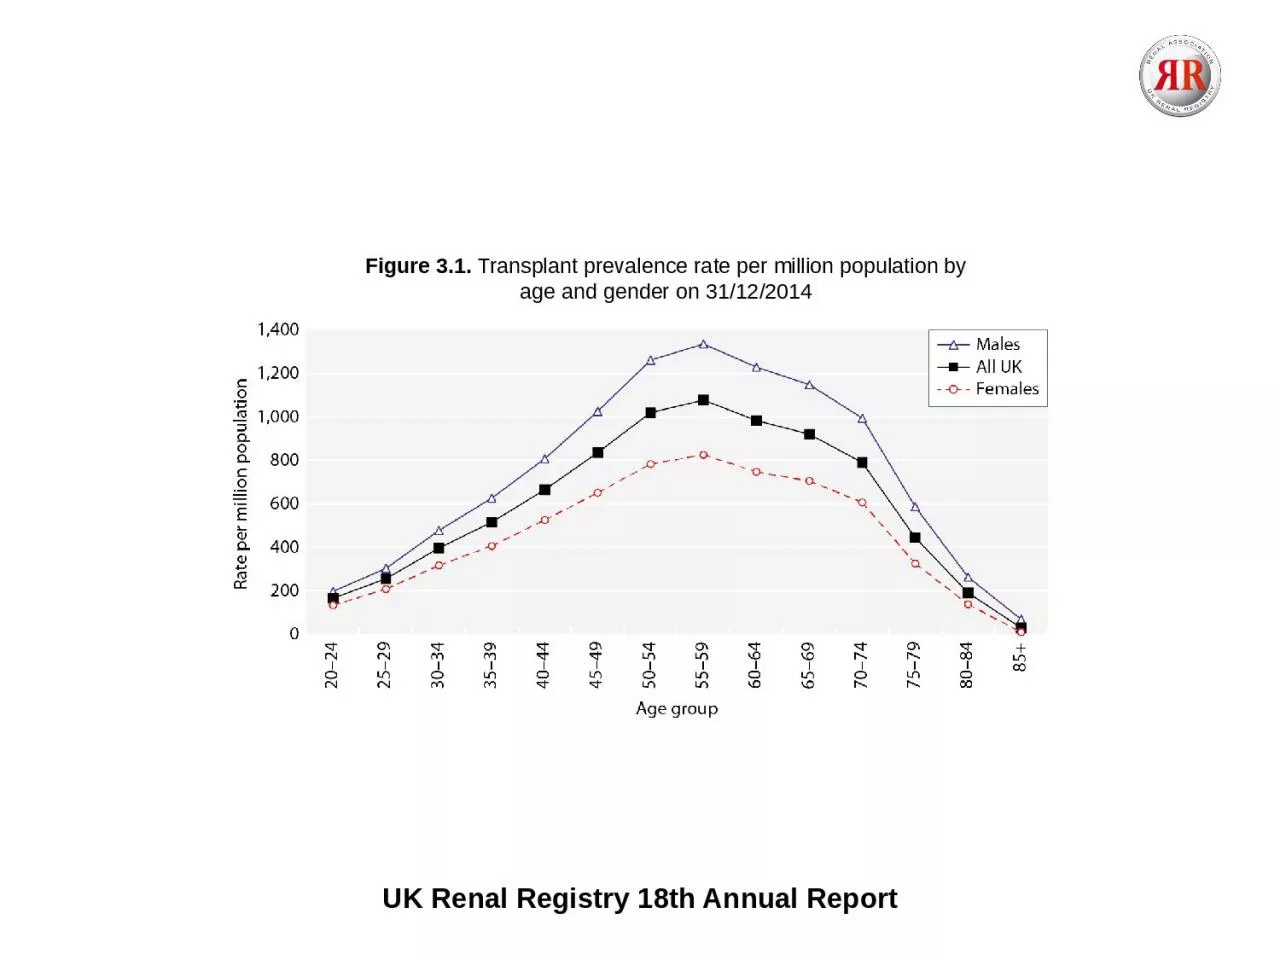
Figure 31 Transplant prevalence rate per million population by age and gender on 31122014 UK Renal Registry 18th Annual Report Figure 32 Median eGFR in prevalent transplant patients by centre on 31122014 ID: 1014849
Download Presentation The PPT/PDF document "UK Renal Registry 18th Annual Report" is the property of its rightful owner. Permission is granted to download and print the materials on this web site for personal, non-commercial use only, and to display it on your personal computer provided you do not modify the materials and that you retain all copyright notices contained in the materials. By downloading content from our website, you accept the terms of this agreement.
1. UK Renal Registry 18th Annual ReportFigure 3.1. Transplant prevalence rate per million population by age and gender on 31/12/2014
2. UK Renal Registry 18th Annual ReportFigure 3.2. Median eGFR in prevalent transplant patients by centre on 31/12/2014
3. UK Renal Registry 18th Annual ReportFigure 3.3. Percentage of prevalent transplant patients by centre on 31/12/2014 with eGFR <30 ml/min/1.73 m2
4. UK Renal Registry 18th Annual ReportFigure 3.4. Funnel plot of percentage of prevalent transplant patients with eGFR <30 ml/min/1.73 m2 by centre size on 31/12/2014
5. UK Renal Registry 18th Annual ReportFigure 3.5a. Median eGFR one year post-live donor transplant by transplant centre 2007–2013
6. UK Renal Registry 18th Annual ReportFigure 3.5b. Median eGFR one year post-brainstem death donor transplant by transplant centre 2007–2013
7. UK Renal Registry 18th Annual ReportFigure 3.5c. Median eGFR one year post-circulatory death donor transplant by transplant centre 2007–2013
8. UK Renal Registry 18th Annual ReportFigure 3.6a. Median eGFR one year post-live donor transplant by year of transplantation 2007–2013
9. UK Renal Registry 18th Annual ReportFigure 3.6b. Median eGFR one year post-brainstem death donor transplant by year of transplantation 2007–2013
10. UK Renal Registry 18th Annual ReportFigure 3.6c. Median eGFR one year post-circulatory death donor transplant by year of transplantation 2007–2013
11. UK Renal Registry 18th Annual ReportFigure 3.7a. Median haemoglobin for prevalent transplant patients with eGFR >30 ml/min/1.73 m2 by centre on 31/12/2014
12. UK Renal Registry 18th Annual ReportFigure 3.7b. Median haemoglobin for prevalent transplant patients with eGFR <30 ml/min/1.73 m2 by centre on 31/12/2014
13. UK Renal Registry 18th Annual ReportFigure 3.8a. Percentage of prevalent transplant patients with eGFR >30 ml/min/1.73 m2 achieving haemoglobin >100 g/L by centre on 31/12/2014
14. UK Renal Registry 18th Annual ReportFigure 3.8b. Percentage of prevalent transplant patients with eGFR <30 ml/min/1.73 m2 achieving haemoglobin >100 g/L by centre on 31/12/2014
15. UK Renal Registry 18th Annual ReportFigure 3.9. Funnel plot of percentage of prevalent transplant patients with haemoglobin <100 g/L by centre size on 31/12/2014
16. UK Renal Registry 18th Annual ReportFigure 3.10a. Percentage of prevalent transplant patients with eGFR >30 ml/min/1.73 m2 achieving blood pressure of <130/80 mmHg by centre on 31/12/2014
17. UK Renal Registry 18th Annual ReportFigure 3.10b. Percentage of prevalent transplant patients with eGFR <30 ml/min/1.73 m2 achieving blood pressure of <130/80 mmHg by centre on 31/12/2014
18. UK Renal Registry 18th Annual ReportFigure 3.11. Cause of death by modality for prevalent patients on 1/1/2014, who died in 2014