PPT-A comparison of hybrid variational data assimilation methods in the Met Office
Author : karlyn-bohler | Published Date : 2019-11-03
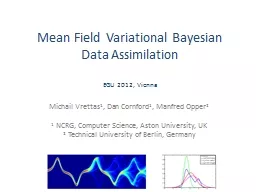
A comparison of hybrid variational data assimilation methods in the Met Office global NWP system Andrew Lorenc 11 th Adjoint Workshop Aveiro Portugal July 2018 wwwmetofficegovuk
Presentation Embed Code
Download Presentation
Download Presentation The PPT/PDF document "A comparison of hybrid variational data..." is the property of its rightful owner. Permission is granted to download and print the materials on this website for personal, non-commercial use only, and to display it on your personal computer provided you do not modify the materials and that you retain all copyright notices contained in the materials. By downloading content from our website, you accept the terms of this agreement.
A comparison of hybrid variational data assimilation methods in the Met Office: Transcript
Download Rules Of Document
"A comparison of hybrid variational data assimilation methods in the Met Office"The content belongs to its owner. You may download and print it for personal use, without modification, and keep all copyright notices. By downloading, you agree to these terms.
Related Documents