/
MONETARY AND FINANCIAL DEVELOPMENTS MONETARY AND FINANCIAL DEVELOPMENTS

MONETARY AND FINANCIAL DEVELOPMENTS - PDF document

karlyn-bohler
karlyn-bohler . @karlyn-bohler
Follow
373 views
Uploaded On 2017-11-24

MONETARY AND FINANCIAL DEVELOPMENTS - PPT Presentation

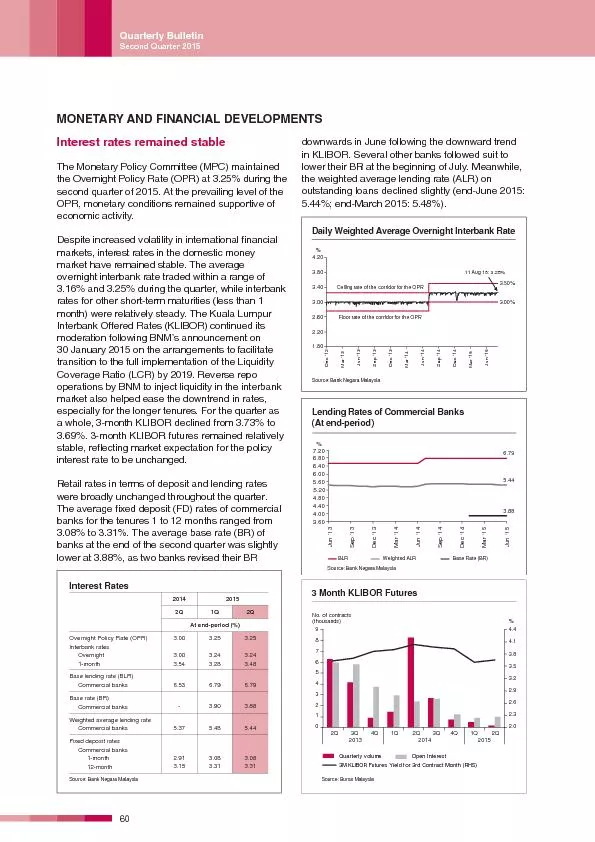
Interest rates remained stable The Monetary Policy Committee MPC maintained the Overnight Policy Rate OPR at 325 during the second quarter of 2015 At the prevailing level of the OPR monetary ID: 608535

Interest rates remained stable

Share:

Link:

Embed:

Download Presentation from below link

Download Pdf The PPT/PDF document "MONETARY AND FINANCIAL DEVELOPMENTS" is the property of its rightful owner. Permission is granted to download and print the materials on this web site for personal, non-commercial use only, and to display it on your personal computer provided you do not modify the materials and that you retain all copyright notices contained in the materials. By downloading content from our website, you accept the terms of this agreement.


Presentation Transcript

MONETARY AND FINANCIAL DEVELOPMENTS Interest rates remained stable The Monetary Policy Committee (MPC) maintained the Overnight Policy Rate (OPR) at 3.25% during the second quarter of 2015. At the prevailing level of the OPR, monetary conditions remained supportive of nancial markets, interest rates in the domestic money market have remained stable. The average overnight interbank rate traded within a range of 3.16% and 3.25% during the quarter, while interbank rates for other short-term maturities (less than 1 month) were relatively steady. The Kuala Lumpur Interbank Offered Rates (KLIBOR) continued its moderation following BNMs announcement on 30 January 2015 on the arrangements to facilitate transition to the full implementation of the Liquidity Coverage Ratio (LCR) by 2019. Reverse repo operations by BNM to inject liquidity in the interbank market also helped ease the downtrend in rates, especially for the longer tenures. For the quarter as a whole, 3-month KLIBOR declined from 3.73% to 3.69%. 3-month KLIBOR futures remained relatively ecting market expectation for the policy interest rate to be unchanged. Retail rates in terms of deposit and lending rates were broadly unchanged throughout the quarter. xed deposit (FD) rates of commercial banks for the tenures 1 to 12 months ranged from 3.08% to 3.31%. The average base rate (BR) of banks at the end of the second quarter was slightly lower at 3.88%, as two banks revised their BR downwards in June following the downward trend in KLIBOR. Several other banks followed suit to lower their BR at the beginning of July. Meanwhile, the weighted average lending rate (ALR) on outstanding loans declined slightly (end-June 2015: 201420152Q1Q2Q Source: Bank Negara Malaysia 3.00% 11 Aug 15: 3.25% Source: Bank Negara MalaysiaWeighted ALR BLRLending Rates of Commercial Banks (At end-period) Jun ‘13 Sep ‘13 Dec ‘13 Mar ‘14 Jun ‘14 Jun ‘15 Sep ‘14 Dec ‘14 Mar ‘15 3 Month KLIBOR Futures Quarterly volume Open Interest 3M KLIBOR Futures Yield for 3rd Contract Month (RHS) of contracts (thousands)Source: Bursa Malaysia2Q 3Q 4Q 1Q 2Q 3Q 4Q 1Q 2Q Quarterly BulletinSecond Quarter 2015 M3 moderated during the quarter M1, or narrow money, increased marginally by RM0.2 billion during the quarter. On an annual June (end-March 2015: 10.2%). M3, or broad on-quarter basis while still recording an annual growth rate of 6.0% as at end-June (end-March The decrease in M3 during the quarter was driven mainly by lower net claims on the Government, re ecting private sector purchase of Malaysian Government Securities (MGS) and Government Investment Issues (GII), which were raised in anticipation of the maturity of Government bonds in 2H 2015. The moderation in M3 was also on account of lower net foreign assets of the  nancial system following net external out ows during the quarter. Nevertheless, the decrease in M3 was partially offset by the continued extension of credit to households and businesses. In the banking system, liquidity conditions remained ample at both the institutional and system-wide levels. The level of surplus liquidity placed with BNM was relatively stable during the quarter. Nevertheless, the composition of monetary instruments used to absorb surplus liquidity was adjusted to provide banks with greater  exibility in managing their liquidity position. In particular, the issuance of BNM bills were replaced with other instruments of a shorter maturity, such as money market borrowings and repos, allowing the surplus liquidity of banks placed with BNM to mature more frequently so that banks can meet any sudden withdrawal of funds due to foreign out ows. Interest Rate Swap: Rates 1 year 3 years 5 years Source: Bloomberg1Q 2Q 1Q 2Q 3Q 4Q 2Q 3Q 4Q 2013 2014 2015 Monetary AggregatesSource: Bank Negara Malaysia 2Q 3Q 4Q 1Q 2Q 3Q 4Q 1Q 2Q Outstanding Liquidity Placed with Bank Negara Malaysia (At end-period, RM billion)RM billion Repos Bank Negara Monetary Notes (BNMN) SRR Money Market Borrowings (excluding repos) Source: Bank Negara Malaysia 3Q 4Q 1Q 2Q 3Q 4Q 1Q 2Q 2013 2014 2015 201420152Q1H1Q2Q1H uences-11.811.7Determinants of Broad Money, M3 Quarterly BulletinSecond Quarter 2015 Private sector  nancing activity was sustained in the second quarter In the second quarter, total gross  nancing level of credit being extended mainly to the wholesale and retail trade, and restaurants and sectors. In particular,  nancing for SMEs continued to be strong, with outstanding SME loans growing at a steady rate of 17.2% (1Q 2015: 17.2%). Demand for new  nancing by businesses remained strong, with higher loan applications compared to the previous quarter by both large corporates and SMEs. This was matched by higher loan approvals to both segments. Net  nancing to the household sector expanded by RM12.9 billion in the second quarter (1Q 2015: RM16.3 billion). On an annual basis, outstanding household loans growth moderated to 8.7% during the quarter Net lending to businesses by the banking system expanded by RM8.1 billion during the quarter (1Q 2015: RM9.8 billion). On an annual basis, outstanding business loans June (end-March 2015: 8.9%). Nonetheless, the amount of loans disbursed to businesses increased during the quarter with a higher Gross Private Sector Financing through theBanking System and Capital Market Loan Disbursed Gross PDS Issued (excl. Cagamas and foreign issuances) EquitySource: Bank Negara Malaysia 2Q 3Q 4Q 1Q 2Q 3Q 4Q 1Q 2Q 2013 2014 2015 Source: Bank Negara Malaysia Bank Lending to SMEsLoan Applications Loan Disbursements 2Q 3Q 4Q 1Q 2Q 3Q 4Q 1Q 2Q 2013 2014 2015 During the period (RM billion)Annual growth (%)20142015201420152Q1H1Q2Q1H2Q1H1Q2Q1H nancing nancing (A)+(B)11.511.3* Banking systems loans include loans sold to Cagamas Quarterly BulletinSecond Quarter 2015 Loan Indicators During the period (RM billion)Annual growth (%) 20142015201420152Q1H1Q2Q1H2Q1H1Q2Q1HTotal116.0112.6119.3116.611.511.211.5-11.111.211.511.9-11.9* The annual growth is for end-period. nancial institutions, government, domestic other entities and foreign entities, except for loan outstanding which refers to businesses only. Share of totalShare of total2Q 20141H 20141Q 20152Q 20151H 2015 shingElectricity, gas and water supplyTransport, storage and communication11.7112.611.011.7Total258.1516.5267.4266.7534.1100.0100.0 nancial institutions, government, domestic other entities and foreign entities. Quarterly BulletinSecond Quarter 2015 Higher net funds raised in the capital market Net funds raised in the capital market increased to RM39.3 billion in the second quarter (1Q 2015: RM21.0 billion). The increase was due mainly to higher net issuances of government and private debt securities. Net funds raised by the public sector increased during the quarter to RM30.1 billion (1Q 2015: RM13.2 billion). Funds were raised through new issuances of a 5-year Malaysian Government Security (MGS) and 3-year and 10-year Government Investment Issue (GII), as well as the re-opening of a 7-year, 10-year and 20-year MGS and 5-year and 7-year GII. Additionally, funds were raised via a RM3.5 billion issuance of the Government Housing Sukuk. There were no In the private sector, net funds raised were also higher at RM9.1 billion (1Q 2015: RM7.8 billion), due mainly to higher net issuances of private debt securities (PDS). Funds raised in the PDS market were mainly driven by issuances in the nance, insurance, real estate and business sector. Meanwhile, equity issuances during the quarter moderated to RM3.3 billion (1Q 2015: RM4.7 billion). 201420152Q1H1Q2Q1H11.9 13.8 11.8 - 13.8 11.8Total 17.2 56.6 21.0 39.3 60.2 Quarterly BulletinSecond Quarter 2015 Marginal increase in medium- to long-term bond yields Despite increased volatility in the global  nancial in the  rst two months of the second quarter. Secondary trading in the bond market declined global  nancial markets. The decline in turnover New activitiesRefinancingMergers & 1Q 2015 1 Includes issuance by non-residents & Cagamas and for the purpose of working capital and general business activitiesSource: Bank Negara Malaysia% 2.2 0.7 63.1 12.0 4.5 0.6 82.9 10 Source: Bank Negara Malaysia Trend in MGS Yields 1 2 3 4 5 6 7 8 9 10 Jun 2015 5 year MGS and 5 year Corporate Bond Yield 2013 2014 2015 Liquidity Ratio: Value of Bond Traded / 2Q 2015 MGS 0.00 0.05 0.10 0.15 0.20 0.25 0.30 0.35 0.40 0.45 65 Quarterly BulletinSecond Quarter 2015 FBM KLCI declined during the quarter The FBM (FTSE Bursa Malaysia) KLCI declined by 6.8% to close at 1,706.6 points as at end-June 2015 (end-March 2015: 1,830.8 points). The decline was mainly driven by the liquidation of non-resident investors holdings amid increased expectations of an end. In tandem with regional equity markets, sentiments were further affected towards the end of the quarter amid heightened investors risk aversion following concerns on Greece debt crisis. Overall, market capitalisation declined to March 2015: RM1.74 trillion) while the daily average turnover declined to 1.92 billion units (1Q 2015: 2.11 billion units) during the quarter. On 11 August 2015, the KLCI ended lower at 1636.7 points (since end-June 2015: -4.1%), with market capitalisation of RM1.60 1Q 20152Q 2015 Markets in 2015 (% growth QoQ) -15 -10 -5 0 5 10 15 20 Bursa Malaysia: Selected Market Indicators 20142015JuneMarJune 1,882.7 13,049.8 6,668.8 1,830.8 12,563.4 7,120.2 1,706.6 11,771.9 6,220.3 2Q1Q2QAverage daily turnoverVolume (million units)Value (RM million)From 3 August 2009, MESDAQ market was replaced with ACE Market Bursa Malaysia: Market Turnover 201420152Q1H1Q2Q1HTurnoverTrading/Services 118.2 11.9 117.7 11.1 114.1 From 3 August 2009, MESDAQ market was replaced with ACE Market Quarterly BulletinSecond Quarter 2015 Market activity in the foreign exchange derivatives market rose with higher volatility in the  nancial markets Foreign exchange derivatives volume grew by 11.0% (qoq) in the second quarter of 2015 (1Q 2015: -5.6%). There was a rise mainly in foreign exchange forward and swap activities by residents, which expanded by 46.9% from 1Q 2015 as local exporters took advantage of the appreciating US dollar to hedge their foreign currency exposure through forward selling of the US dollar. The foreign exchange swap market was also active as interbank players facilitated increased trading and hedging in a more volatile market environment. During the quarter, average 1-month implied ringgit volatility was at 8.9%, Ringgit depreciation driven by external and domestic factors to the in ow of funds into regional  nancial decreased interest in regional  nancial assets. Overall, the ringgit depreciated by 1.8% against the US dollar during the quarter. The ringgit also depreciated against the Japanese yen (-0.1%), the Australian dollar (-2.5%), the euro (-5.2%), and the pound sterling (-7.7%). Against all regional currencies except the Thai baht (2.0%), the ringgit Source: Bank Negara Malaysia Percent Change (1 April - 30 June 2015) -10 -8 -6 -4 -2 0 2 4 GBP CNY KRW PHP JPY Quarterly BulletinSecond Quarter 2015 Ringgit Performance against Major Source: Bank Negara Malaysia indicates ringgit appreciation 90 92 100 31 Mar 9 Apr 18 Apr 29 Apr 9 May 21 May 30 May USD U (End March 2015=100) indicates ringgit appreciation Source: Bank Negara Malaysia Ringgit Performance against Regional Currencies Index(End March 2015=100) 94 96 100 110 31 Mar 9 Apr 18 Apr 9 May 21 May 10 Jun IDR PHP SGD As at end% change since*21 Jul 20052Q 20141Q 20152Q 201521 Jul 20052Q 20141Q 2015100 Thai baht100 New Taiwan dollar11.89011.4238.311111.87411.20511.3-11.7 Quarterly BulletinSecond Quarter 2015