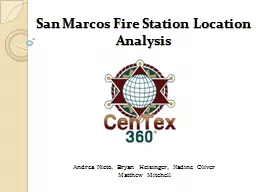
/
San Marcos Fire Station Location Analysis San Marcos Fire Station Location Analysis

San Marcos Fire Station Location Analysis - PowerPoint Presentation

karlyn-bohler
karlyn-bohler . @karlyn-bohler
Follow
412 views
Uploaded On 2018-01-31

San Marcos Fire Station Location Analysis - PPT Presentation

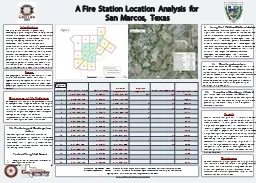
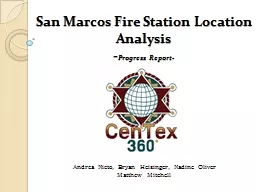
Andrea Nieto Bryan Heisinger Nadine Oliver Matthew Mitchell Introduction Summary According to the United States Census Bureau between 2010 and 2011 San Marcos experienced a 4 increase in population reaching more than 45000 people ID: 626805

san fire city marcos fire san marcos city urban area factors station data stations parcel buildings square fires population

Share:

Link:

Embed:

Download Presentation from below link

Download Presentation The PPT/PDF document "San Marcos Fire Station Location Analysi..." is the property of its rightful owner. Permission is granted to download and print the materials on this web site for personal, non-commercial use only, and to display it on your personal computer provided you do not modify the materials and that you retain all copyright notices contained in the materials. By downloading content from our website, you accept the terms of this agreement.


Presentation Transcript

Slide1

San Marcos Fire Station Location Analysis

Andrea Nieto, Bryan Heisinger, Nadine Oliver Matthew MitchellSlide2

Introduction

Slide3

Summary

According to the United States Census Bureau, between 2010 and 2011, San Marcos experienced a 4% increase in population, reaching more than 45,000 people. To meet the demand of this growth trend, the City of San Marcos is proactively developing a plan to construct a new fire station.Slide4

Purpose

The purpose of this study is to determine potential locations in San Marcos where the economic and demographic conditions of the area justify the construction of a fire station. We will consider the following factors: parcel area, parcel value, day/night time population, square footage of buildings, value of improvements, conflagration potential and wildlife urban interfaces.

Slide5

Scope

San Marcos, Texas is approximately 30 square miles and contains about 1500 people per square mile (United States Census Bureau). Our research will consist of analyzing 11 grid cells that have been pre-determined by the City of San

Marcos

and do not contain a fire station.

The shape of the grid cells have been derived from a similar study that published by the City of Austin. Slide6

Literature ReviewSlide7

An Equation for Station Location

Objective: Determine areas of Austin, Texas that demonstrated a need for future fire stations.Fire Chief Bill Roberts developed a diamond-shape grid system to delineate emergency fire service areas.Factors included: -distance from existing stations

-fire frequency of the area

-development patterns

-population distributions

-taxable improvements

-square footage of structures

Sybesma

, Pieter. (1995). An Equation for Station Location. 

Fire Chief

 Oct. 1995: 55-65. Print.Slide8

Urban

Conflagrations:Strategy and tactics applied to large area fires in urban areasThis article describes in detail factors associated with urban conflagration and provides case-study examples of past urban area fires.

Factors:

closely

built structures;

wildland

/urban interfaces

the

use of untreated wood shingles as exterior covering for roofs or walls;

poor water supplies, weaknesses in automatic or manual fire suppression systems;

dilapidated structures, especially abandoned buildings in large numbers;

large-scale combustible construction or demolition projects;

built-up

areas near high-hazard locations,

Klaene

, B., & Sanders, R. (2008). Urban conflagrations.

NFPA Journal, 102

(6), 28-28,86. Retrieved from

http://www.nfpa.org/publiccolumn.asp?categoryid=1693&itemid=40848&src=nfpajournal&cookie_test=1Slide9

Locating fire stations: An integrated approach for Belgium

Funded by the Belgium Ministry of the Interior to assess the need for improving and optimizing fire station locationsUsed a risk modeling and location-allocation approach to determine the lowest-cost option for ensuring 90% of fires can be reached within a specific time frame. Factors: -past fire incidences

-census data

-road networks

-intervention rules and norms

Similar objective, but different in its scale and approach.

Fig. 4. Estimated density of fires in dwellings (number of fires per year and per square kilometer). Note: between brackets: number of communes in each interval.

Chavalier

,

Phillippe

, and Isabelle Thomas. "Locating Fire Stations: An Integrated Approach for Belgium."

Socio-Economic Planning Sciences

46 (2012): 173-82. Retrieved from

http://www.sciencedirect.com/science/article/pii/S0038012112000080Slide10

DataSlide11

Data Needed

City grid composed of cells Parcels layer of the City of San MarcosA buildings layer Tax

roll spreadsheet

Parks Layer

*

All data has been provided by the City of San Marcos*Slide12

MethodologySlide13

Methodology cont. Slide14

Methodology cont.Slide15

Methodology cont.

Parcel Area (developed/undeveloped)Parcel ValuePopulation (day/night)Building Sq. FootageValue of Improvements

Wildlife and Urban InterfaceSlide16

Spreadsheet

Parcel_ID

Developed/Undeveloped

Multifamily (Y/N)

Commercial/Residential

Population

Building Sq. Footage

VOI

Parcel Value

Acreage

Wildlife/Urban

Interface (Y/N)Slide17

Conflagration Index

Purpose: create an index to compare the likelihood that a fire will spread from one structure to another in a given area. Factors and WeightsProximity of buildings to each other

(5)

Wildland

/Urban

interface

(3)

F

requency

of buildings three stories in height or greater

(2)

The combination and weights of these factors we believe will reasonably gauge the potential an area has for conflagration. It will also be able to be used as a basis of comparison between areas as a factor for our broader analysis. Slide18

Implications

Short term:Assist in educating policy makers with decisions regarding the expansion of the San Marcos Fire Department.Aid the Fire Department by providing them with a detailed report regarding the characteristics of the area they service.

Long term

:

Preemptively determining the siting of future fire stations will allow the city services to accommodate predicted population growth trends and provide the best possible service to its citizens. Slide19

BudgetSlide20
Slide21

Total Cost

$19,010.25

Budget BreakdownSlide22

TimetableSlide23

Final Deliverables

Upon completion of the project, we will present the City of San Marcos and the Texas State University Geography Department with a poster, a website, and a CD of our final analysis which will include the following documentation:All data usedMetadataPowerPoint highlighting our final analysisFinal Report

Map

(or map book) of each grid cell

Spreadsheet containing all statistics that were calculated through analysis

Summary of project explaining

methodology

Electronic Data Copy (CD)Slide24

Conclusion

The result of this project will provide the City of San Marcos with an organized and efficient database of factors. This is needed to justify the cost of construction as well as help plan for future fire stations accordingly. The City of San Marcos can potentially use our project and expand upon our maps and models to meet their evolving needs as the city grows.Slide25

Questions?