/
U S Energy Information Administration  Drilling Productivity Report                  Oil U S Energy Information Administration  Drilling Productivity Report                  Oil

U S Energy Information Administration Drilling Productivity Report Oil - PDF document

karlyn-bohler
karlyn-bohler . @karlyn-bohler
Follow
609 views
Uploaded On 2014-12-21

U S Energy Information Administration Drilling Productivity Report Oil - PPT Presentation

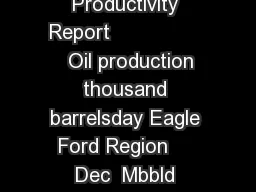
S Energy Information Administration Drilling Productivity Report 200 400 600 800 1000 1200 1400 1600 2007 2008 2009 2010 2011 2012 2013 2014 2015 Oil production thousand barrelsday Eagle Ford Region 50 100 15 ID: 27329

Energy Information Administration

Share:

Link:

Embed:

Download Presentation from below link

Download Pdf The PPT/PDF document "U S Energy Information Administration D..." is the property of its rightful owner. Permission is granted to download and print the materials on this web site for personal, non-commercial use only, and to display it on your personal computer provided you do not modify the materials and that you retain all copyright notices contained in the materials. By downloading content from our website, you accept the terms of this agreement.


Presentation Transcript

U. S. Energy Information Administration | Drilling Productivity Report 0 300 600 900 1,200 1,500 1,800 2011 2012 2013 2014 2015 2016 2017 2018 2019 2020 Oil production thousand barrels/day Eagle Ford Region -40 -20 0 20 40 Oct 1,048 Mbbl/d Production from new wells Legacy production change Net change Nov 1,014 Mbbl/d thousand barrels/day Eagle Ford Region +25 - 59 - 34 Indicated change in oil production (Nov vs. Oct) -120 -60 0 60 120 Oct 5,903 MMcf/d Production from new wells Legacy production change Net change Nov 5,785 MMcf/d Indicated change in natural gas production (Nov vs. Oct) million cubic feet Eagle Ford Region +87 - 205 - 118 0 50 100 150 200 250 300 350 0 500 1,000 1,500 2,000 2,500 2011 2013 2014 2015 2016 2017 2018 2019 2020 new-well oil production per rig rig count New - well oil production per rig barrels/day Eagle Ford Region Rig count rigs (450) (400) (350) (300) (250) (200) (150) (100) (50) 0 2011 2012 2013 2014 2015 2016 2017 2018 2019 2020 Legacy oil production change thousand barrels/day (1,440) (1,280) (1,120) (960) (800) (640) (480) (320) (160) 0 2011 2012 2013 2014 2015 2016 2017 2018 2019 2020 Legacy gas production change million cubic feet /day Eagle Ford Region Eagle Ford Region 0 2,000 4,000 6,000 8,000 10,000 2011 2012 2013 2014 2015 2016 2017 2018 2019 2020 Eagle Ford Region Natural gas production million cubic feet /day 0 50 100 150 200 250 300 350 0 3,000 6,000 9,000 12,000 15,000 2011 2012 2013 2014 2015 2016 2017 2018 2019 2020 new-well gas production per rig rig count New - well gas production per rig thousand cubic feet /day Eagle Ford Region Rig count rigs drilling data through September projected production through November October 2020 Drilling Productivity Report November barrels/day October barrels /day month over month Oil +49 Gas thousand cubic feet/day month over month +171 Monthly additions from one average rig Eagle Ford Region million cubic feet/day month over month 8,694 November thousand cubic feet/day October 8,523 2,498 2,449 thousand barrels /day month over month Oil - 34 Gas - 118 6