/
LSU Health Sciences Center LSU Health Sciences Center

LSU Health Sciences Center - PDF document

kimberly
kimberly . @kimberly
Follow
344 views
Uploaded On 2021-10-01

LSU Health Sciences Center - PPT Presentation

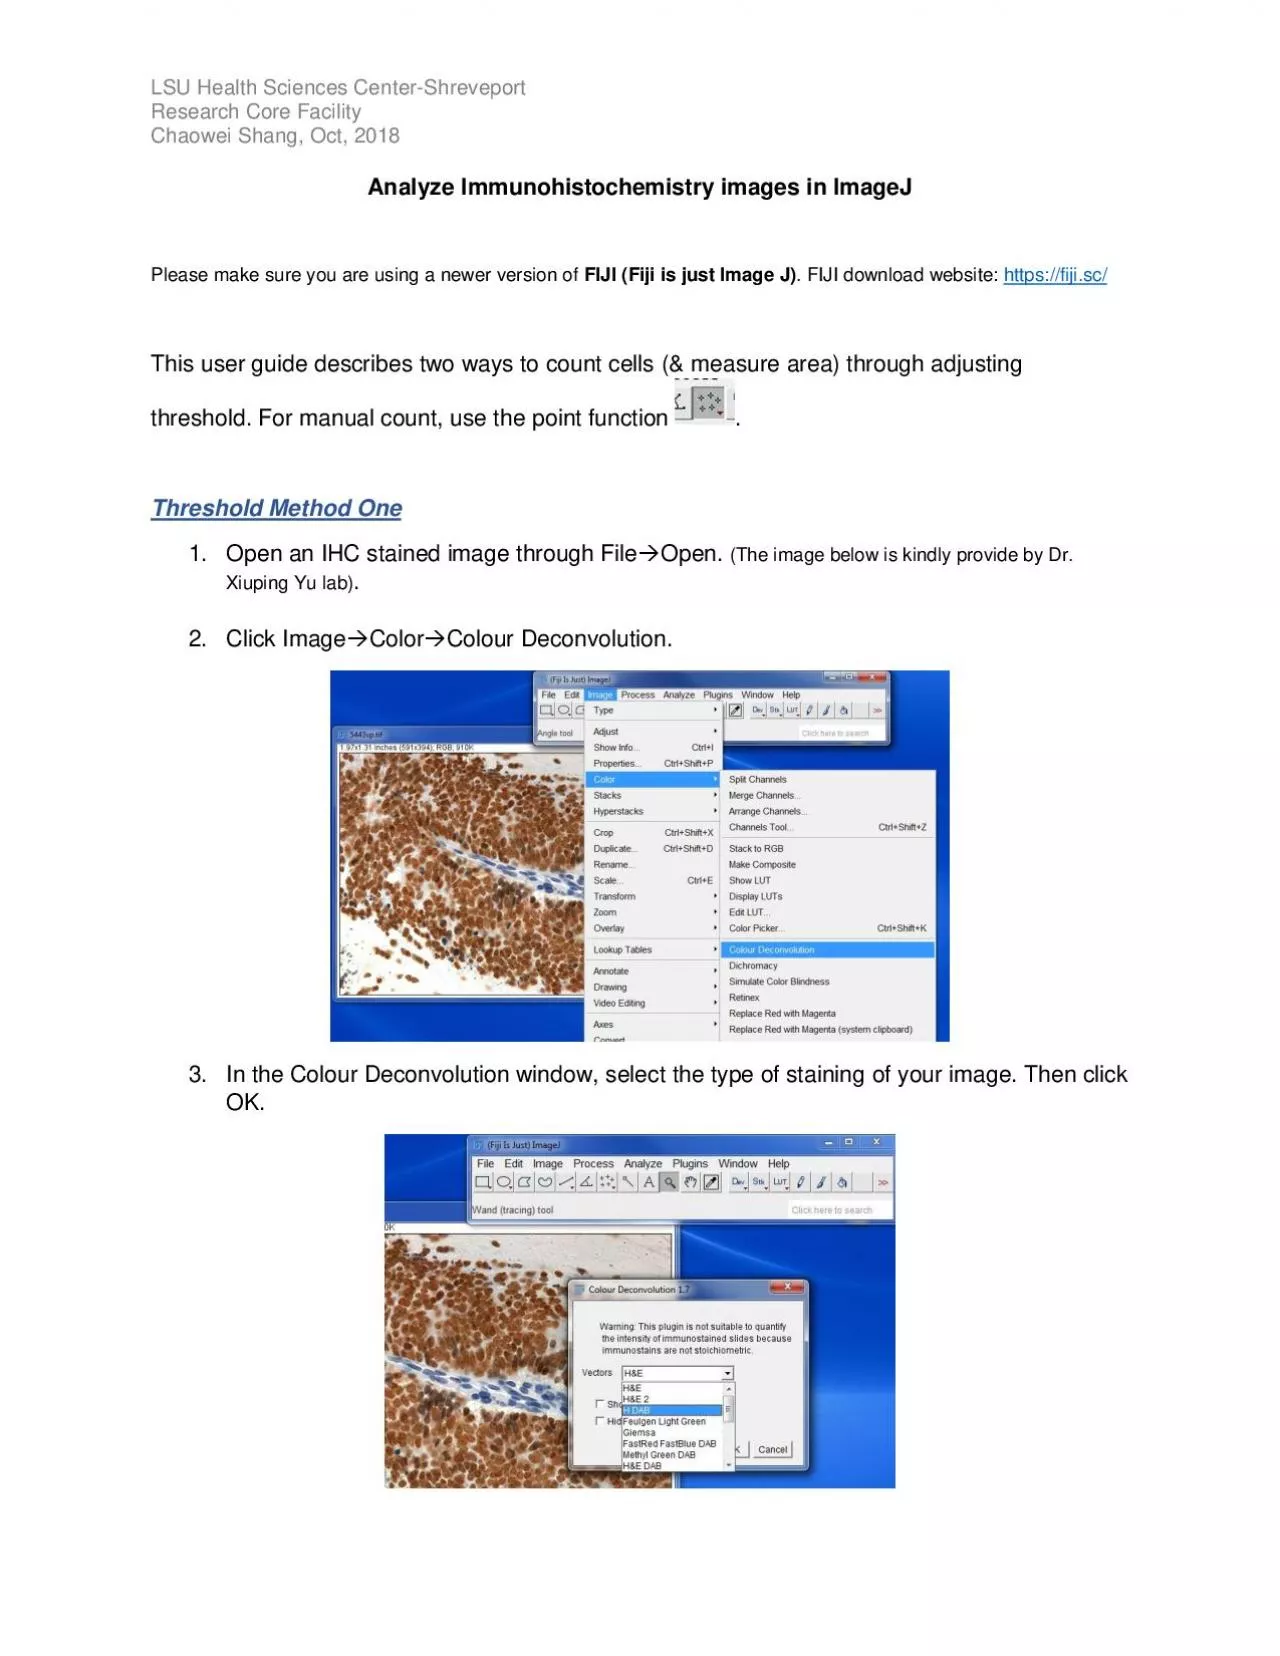
ShreveportResearch Core FacilityChaowei ShangOct 2018AnalyzeImmunohistochemistry imagesin ImageJPlease make sure you are using a newer version of FIJI Fiji is just Image JFIJIdownloadwebsitehttpsfi ID: 891315

threshold image ang lsu image threshold lsu ang health 2018 oct color chaowei core research sciences center shreveport facility

Share:

Link:

Embed:

Download Presentation from below link

Download Pdf The PPT/PDF document "LSU Health Sciences Center" is the property of its rightful owner. Permission is granted to download and print the materials on this web site for personal, non-commercial use only, and to display it on your personal computer provided you do not modify the materials and that you retain all copyright notices contained in the materials. By downloading content from our website, you accept the terms of this agreement.


Presentation Transcript

1 LSU Health Sciences Center - Shreveport
LSU Health Sciences Center - Shreveport Research Core Facility Chaowei S h ang, Oct, 2018 Analyze Immunohistochemistry images in ImageJ Please make sure you are using a newer version of FIJI ( Fiji is just I mage J ) . FIJI download website: https://fiji.sc/ This user guide describes two ways to count cells ( & measur e area ) through adjusting threshold. F or manual count, use the point function . Threshold Method One 1. Open an IHC stained image through File  Open.

2 ( The image below is kindly provide by
( The image below is kindly provide by Dr. Xiuping Yu lab ) . 2. Click Image  Color  Colour Dec onvolution. 3. In the Colour Deconvolution window, select the type of staining of your image. Then click OK. LSU Health Sciences Center - Shreveport Research Core Facility Chaowei S h ang, Oct, 2018 4. T he origi nal im age is then split into 3 single colo red images. In the example provided below, only colo r 1 and color 2 are needed. Close the unwanted image. Sav

3 e the other tw o images as Tiff files
e the other tw o images as Tiff files ( File  Save ) . The saved images are 8 - bit by default . 5. Open one of the single colored images, go to Image  Adjust  Threshold . ( Although it has color, this is not a RGB image ) . 6. In the Threshold window, pixels that are within the red box are being selected. Red color in the image indicates selected area . In the example below, the background is selected. LSU Health Sciences Center - Shreveport Research Core Facility

4 Chaowei S h ang, Oct, 2018 7.
Chaowei S h ang, Oct, 2018 7. Drag the bars ( 0 - 255 ) to modify the selected area. 8. Then click Apply. A Binary image is created. LSU Health Sciences Center - Shreveport Research Core Facility Chaowei S h ang, Oct, 2018 9. C lick Process  Binary  Watershed. I magined separation lines among cells will appear. The watershed function is less accurate if your cells are too crowded. 10. Next, click Analyze  Analyze P articles . In the Analyze Pa

5 rticles window, the size of particles i
rticles window, the size of particles is important if you have tiny dots that are selected within the threshold, but they are not cells. S et the minimum particle size to ex c lude them. In the ex ample below, 0.0002 inch^2 is used ( do the measurement for your image ) . It is better to select Ou t line in the Show option. Then click OK. 11. For results, you will see 3 windows as shown below. In the counting map, you can clearly see which cells are being counted. The unwanted dots are elimi

6 nated. LSU Health Sciences Center - Sh
nated. LSU Health Sciences Center - Shreveport Research Core Facility Chaowei S h ang, Oct, 2018 Threshold Method two 1. Open an image through File  Open. 2. Then click Image  Adjust  Color Threshold. 3. In the Color Threshold window, you can adjust the thr eshold through RGB or HSB mode . In the example below, RGB mode is used ( For other images, it may be easier to use the HSB mode ) . LSU Health Sciences Center - Shreveport Research Core Facility Chaowei S h ang,

7 Oct, 2018 4. Dra
Oct, 2018 4. Drag the bars ( 0 - 255 grey scale ) under each color to modify the selection. I n the image below, brown staining is selected. To select brown, allow more red and green, and less blue to pass. Select Dark background . LSU Health Sciences Center - Shreveport Research Core Facility Chaowei S h ang, Oct, 2018 5. Next, go to Process  Binary  Make Binary . 6. After a Binary image is c r eated, follow steps 10 - 12 as in Method