/
 Animal Improvement  Program (AIP)  Animal Improvement  Program (AIP)

Animal Improvement Program (AIP) - PowerPoint Presentation

kittie-lecroy
kittie-lecroy . @kittie-lecroy
Follow
344 views
Uploaded On 2020-04-04

Animal Improvement Program (AIP) - PPT Presentation

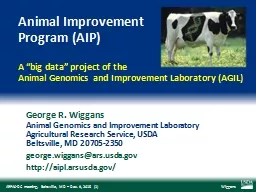
A big data project of the Animal Genomics and Improvement Laboratory AGIL AGIL mission Discover and develop improved methods for the genetic and genomic evaluation of economically important traits of dairy animals and small ruminants ID: 775343

genetic data genomic evaluation genetic data genomic evaluation dairy bulls evaluations sequence traits merit genomics dna genotypes selection million

Share:

Link:

Embed:

Download Presentation from below link

Download Presentation The PPT/PDF document " Animal Improvement Program (AIP)" is the property of its rightful owner. Permission is granted to download and print the materials on this web site for personal, non-commercial use only, and to display it on your personal computer provided you do not modify the materials and that you retain all copyright notices contained in the materials. By downloading content from our website, you accept the terms of this agreement.


Presentation Transcript

Slide1

Animal Improvement Program (AIP)

A “big data” project of the

Animal Genomics and Improvement Laboratory (AGIL)

Slide2

AGIL mission

Discover and develop improved methods for the genetic and genomic evaluation of economically important traits of dairy animals and small ruminantsConduct fundamental genomics-based research aimed at improving their health and productive efficiency

Slide3

Dr. Erin E. Connor, Research Leader10 senior scientists2 postdoctoral associates9 support scientists2 chemists5 laboratory technicians3 information technology specialists2 administrative assistantsVisiting scientists and students

AGIL staff

Slide4

Enhancing genetic merit of ruminants through genome selection and analysis Understanding genetic and physiological factors affecting nutrient use efficiency of dairy cattleDevelopment of genomic tools to study ruminant resistance to gastrointestinal nematodesImproving genetic predictions in dairy animals using phenotypic and genomic information “Animal Improvement Program” (AIP)

AGIL appropriated projects

Slide5

4 senior scientists6 support scientists3 information technology specialists1 administrative assistant2 visiting scientists

AIP staff

Dr. George Wiggans

Dr. Paul VanRaden

Dr. John Cole

Dr. Derek Bickhart

Slide6

AIP objectives

Expand national and international collection of phenotypic and genotypic data

Develop a more accurate genomic evaluation system with advanced, efficient methods to combine pedigrees, genotypes, and phenotypes

Use economic analysis to maximize genetic progress and financial benefits from collected data

Slide7

Genetic evaluation

Improve future performance through selectionPossible dataAnimal’s own measurable traitsPedigrees and phenotypes of relativesGenomic information

Slide8

Phenotypic data

Records for milk yield, fat percentage, protein percentage, and somatic cell count

(1/month)

Appraiser-assigned scores for

16 body and udder characteristics related to conformation

(e.g., stature)

Breeding records that include indicator for conception success

Calving difficulty scores and stillbirth occurrences

Slide9

Primary traits evaluated

Yield

(milk, fat, and protein)

Conformation

(overall and individual traits)

Longevity

(productive life)

Fertility

(conception and pregnancy rates)

Calving

(dystocia and stillbirth)

Disease resistance

(somatic cell score)

Slide10

Data amounts (as of July 2015)

Pedigree records

71,974,045

Animal genotypes

1,035,590

Lactation records

(since 1960)

132,629,200

Daily yield records

(since 1990)

641,864,015

Reproduction event records

176,559,035

Calving difficulty scores

29,528,607

Stillbirth scores

19,567,198

Slide11

Value of incoming data

Data

Annual value

Phenotypes (2014)

4 million cows

×

$1.25/cow/month

$60 million

Genotypes (2014)

15,000 medium

-

density

×

$125

$2 million

258,000 low

-

density

×

$45

$12 million

Whole

-

genome sequence (2015)

200+ bulls

×

$1,000

$0.2 million

1,000+ bulls

×

$3,000

$3 million

Total

$77.2 million

Slide12

Genomics and SNP

Genomics – Applies DNA technology and bioinformatics to sequence, assemble and analyze the function and structure of genomes SNP – Single nucleotide polymorphisms; serve as markers to track inheritance of chromosomal segmentsGenomic selection – Selection using genomic predictions of economic merit early in life

Slide13

Benefit of genomics

Determine value of bull at birth

Increase accuracy of selectionReduce generation intervalIncrease selection intensityIncrease rate of genetic gain

Bovine G-Nome

Slide14

Why genomics works for dairy cattle

Extensive historical data available

Well-developed genetic evaluation program

Widespread use of artificial-insemination (AI) sires

Progeny-test programs

High-value animals worth the cost of genotyping

Long generation interval that can be reduced substantially by genomics

Slide15

Evaluation transition to dairy industry

Council on Dairy Cattle Breeding (CDCB)Database maintenanceCalculation and distribution of geneticmeritestimatesInterface with evaluation users and data suppliersAGILResearch and development using datamadeavailable by CDCB

Slide16

Genomic data flow

DNA samples

genotypes

genomic

evaluations

nominations,pedigree data

genotypequality reports

genomicevaluations

DNA samples

genotypes

DNA samples

Dairy Herd Information

(DHI)

producer

CDCB

DNA laboratory

AI organization,

breed association

Slide17

Evaluation flow

Animal nominated for genomic evaluation by approved nominatorDNA source sent to genotyping lab (2014)

SourceSamples (no.)Samples (%)Blood10,7274Hair113,45539Nasal swab2,9541Semen3,4321Tissue149,30151Unknown12,3014

Slide18

Evaluation flow (continued)

DNA extracted and placed on chipMarker panels that range from 2,900 to 777,962 SNPs3-day genotyping processGenotypes sent from genotyping lab for accuracy review

Slide19

Animals genotyped (cumulative totals)

Slide20

Laboratory quality control

Each SNP evaluated for

Call rate

Portion heterozygous

Parent-progeny conflicts

Clustering investigated if SNP exceeds limits

Number of failing SNPs indicates genotype quality

Target of <10 SNPs in each category

Slide21

Evaluation flow (continued)

Genotype calls modified as necessaryGenotypes loaded into databaseNominators receive reports of parentage and other conflictsPedigree or animal assignments correctedGenotypes extracted and imputed to 61KSNP effects estimatedFinal evaluations calculated

Slide22

Parentage validation and discovery

Parent-progeny conflicts detectedAnimal checked against all other genotypesReported to breeds and requestersCorrect sire usually detectedMaternal grandsire checkingSNP at a time checkingHaplotype checking more accurate

Who’s your daddy?

Slide23

Evaluation flow (continued)

Evaluations released to dairy industryDownload from FTP site with separate files for each nominatorWeekly release of evaluations of new animalsMonthly release for females and bulls not marketedAll genomic evaluations updated 3 times each year with traditional evaluations

Slide24

Parent ages for marketed Holstein bulls

Slide25

Genetic merit of marketed Holstein bulls

Average gain:

$19.42/year

Average gain:$47.95/year

Average gain:

$87.49/year

Slide26

Improving accuracy

Increase size of predictor population

Share genotypes across country

Young bulls receive progeny test

Use more or better SNPs

Account for effect of genomic selection on traditional evaluations

Reduce cost to reach more selection candidates

Slide27

Growth in bull predictor population

BreedJan. 201512-mo gainAyrshire71129Brown Swiss6,112336Holstein26,7592,174Jersey4,448245

Slide28

Haplotypes affecting fertility

Rapid discovery of new recessive defects

Large numbers of genotyped animals

Affordable DNA sequencing

Determination of haplotype location

Significant number of homozygous animals expected, but none observed

Narrow suspect region with fine mapping

Use sequence data to find causative mutation

Slide29

Current research areas

Improve evaluation methodologyDevelop applications for sequence dataAcquire data for additional traitsDevelop evaluations for new traits

Slide30

Mating programs

Genomic relationships of genotyped females with available bulls providedDetermination of best mate possibleDominance effects could be considered

Slide31

Working with sequence data

Sequence data available from 1000 Bull Genomes Project hosted in Australia

Project funded by industry to sequence over 200 bulls to create a

haplotype

library

A posteriori granddaughter design to locate chromosomal segments of interest from 71 bulls each with over 100 genotyped and progeny-tested sons

Slide32

Granddaughter design

Sires with many progeny-tested sons genotyped for genetic markersSons of heterozygous sire divided into 2 groups based on paternal allele receivedSignificant difference in genetic evaluations for 2 son groups indicates sire is segregating for quantitative trait locus (QTL) for trait

M

?

+

m

?

+

M

m

+

Slide33

Alignment of sequence data

Alignment – determining location of chromosomal segments provided by sequencerFindmap – matches segment against library of haplotypesPreserves low-frequency variantsDoes not identify new variantsUses a hash table to find variant enablingrapidprocessing

Slide34

Further use of sequence data

Discovery of causative genetic variants

Refinement of SNPs used in genomic evaluation

Add discovered causative variants

Use some SNPs for imputation but not for estimation of SNP effects

Create genotypes for genomic evaluation from sequence data to enable immediate use through imputation of any new SNPs

Slide35

Additional traits requiring data

Clinical mastitis Displaced abomasumKetosisHoof healthImmune responseOther health traitsFeed efficiencyMethane productionMilk fatty acid composition from mid‐infraredspectroscopy

Slide36

Evaluation of new traits

MortalityDays to first breedingGestation lengthPersistencyResistance to heat stress (predicting genotype × environment interactions)

Slide37

Benefits to dairy industry

Low-cost genotyping tools for genomic predictions of genetic merit

Identification of gene mutations for cow


fertility

Genetic evaluations for more than 30


traits of U.S. dairy cows

Genetic-economic indexes to help dairy farmers choose parents of future generations

Genomic mating programs for dairy cattle

Slide38

Impact on breeders

Haplotype and gene tests in selection and mating programsTrend towards a small number of elite breeders that are investing heavily in genomicsAbout 30% of young males genotyped directly by breeders since April 2013Prices for top genomic heifers can be very high (e.g., $265,000 )

Slide39

Impact on dairy producers

GeneralReduced generation intervalIncreased rate of genetic gainMore inbreeding/homozygosity?SiresHigher average genetic merit of available bullsMore rapid increase in genetic merit for all traitsLarger choice of bulls for traits and semen priceGreater use of young bulls

Slide40

Summary

Highly successful program leading to annual increases in genetic merit for production efficiency

Large database of phenotypic and genomic data provided by industry

Research projects to determine mechanism of genetic control of economically important traits

Data processing techniques developed so that rapid turnaround could be realized

Slide41

Funding acknowledgments

U.S. taxpayers (USDA appropriated project)Council on Dairy Cattle BreedingBinational Agricultural Research & DevelopmentNational Institute of Food and AgricultureWashington State University (NIFA grant)

Slide42

Questions?

Holstein and Jersey crossbreds graze on American Farm Land Trust’s

Cove Mountain Farm in south-central PennsylvaniaSource: ARS Image Gallery, image #K8587-14; photo by Bob Nichols

AIP web site:

http

:

/

/aipl.arsusda.gov