/
Cardiovascular Disease Bridget Dillon Cardiovascular Disease Bridget Dillon

Cardiovascular Disease Bridget Dillon - PowerPoint Presentation

kittie-lecroy
kittie-lecroy . @kittie-lecroy
Follow
368 views
Uploaded On 2018-12-06

Cardiovascular Disease Bridget Dillon - PPT Presentation

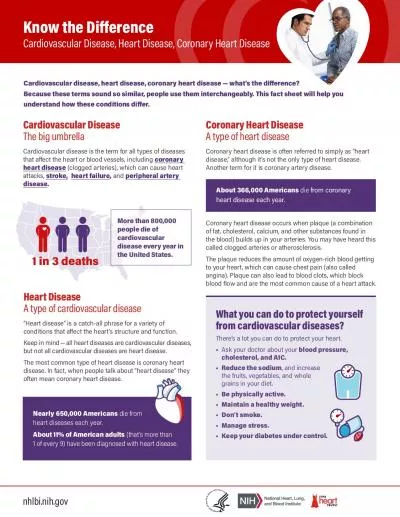
February 11 2013 Cardiovascular disease affects the heart and circulatory system It is often a result of blockages of blood vessels Some examples of Heart Disease are Coronary Artery Disease ID: 737632

stroke heart american disease heart stroke disease american association cardiovascular 127 2013 e245 circulation copyright health deaths gov risk

Share:

Link:

Embed:

Download Presentation from below link

Download Presentation The PPT/PDF document "Cardiovascular Disease Bridget Dillon" is the property of its rightful owner. Permission is granted to download and print the materials on this web site for personal, non-commercial use only, and to display it on your personal computer provided you do not modify the materials and that you retain all copyright notices contained in the materials. By downloading content from our website, you accept the terms of this agreement.


Presentation Transcript

Slide1

Cardiovascular Disease

Bridget Dillon

February 11, 2013Slide2

Cardiovascular disease affects the heart and circulatory system. It is often a result of blockages of blood vessels.

Some examples of Heart Disease are:

Coronary Artery Disease*Heart Attack*Stroke*Rheumatic Heart DiseaseCongenital Defects

Cardiovascular DiseaseSlide3

The American Heart Association has seven different measurements to determine cardiovascular health.

There are four health behaviors: smoking

, physical activity, healthy diet and energy balance demonstrated by healthy weight.There are three health factors: BP, blood glucose and blood cholesterol.

PrevalenceSlide4

Age-standardized prevalence estimates for poor, intermediate, and ideal cardiovascular health for each of the 7 metrics of cardiovascular health in the American Heart Association 2020 goals, among US adults aged ≥20 years,

NHANES 2009-2010

Go A S et al. Circulation 2013;127:e6-e245

Copyright © American Heart AssociationSlide5

Prevalence of stroke by age and sex (National Health and Nutrition Examination Survey: 2007–2010).

Go A S et al. Circulation 2013;127:e6-e245

Copyright © American Heart AssociationSlide6

Incidence

It is harder to pinpoint actually onset disease, but continuous monitoring can provide an estimate.

Often used to indicate first stroke or heart attack suffered.Slide7

Incidence of cardiovascular disease* by age and sex (Framingham Heart Study, 1980–2003). *Coronary heart disease, heart failure, stroke, or intermittent claudication.

Go A S et al. Circulation 2013;127:e6-e245

Copyright © American Heart AssociationSlide8

Incidence of cardiovascular disease according to the number of ideal health behaviors and health factors.

Go A S et al. Circulation 2013;127:e6-e245

Copyright © American Heart AssociationSlide9

Annual age-adjusted incidence of first-ever stroke by race.

Go A S et al. Circulation 2013;127:e6-e245

Copyright © American Heart AssociationSlide10

Proportion of patients with recurrent stroke in 5 years after first stroke.

Go A S et al. Circulation 2013;127:e6-e245

Copyright © American Heart AssociationSlide11

In 2008, 17.3 million people died as a result of CVD (WHO).

30% of global deaths

80% of all CVD deaths occur in low and middle income countriesIn the US, heart disease was the leading cause of death in 2008 (NHLBI).In 2007, heart disease accounted for 190.1 deaths per 100,000 (out of 760.2 per 100,000) in the USStrokes accounted for 42.2 deaths per 100,000.

http

://apps.nccd.cdc.gov/DHDSPAtlas/viewer.aspx?state=MI

MortalitySlide12

Cardiovascular diseases are the number one cause of death globally.

WHO estimates that almost 25 million will die from CVDs by 2030 (mostly heart attack and stroke).

7.5 million deaths each year (13% of all deaths) can be attributed to high blood pressure including 51% of stroke deaths and 47% due to coronary heart disease)MortalitySlide13

Overall US death rate attributable to CVD declined by 37% from 1999 to 2009. (AHA)

It still accounts for 32.3% of all deaths.

In 2009, 34% of deaths attributable to CVD occurred before age 7520% of these (6.8% of total) occur before age 40.

Mortality TrendsSlide14

Cardiovascular disease mortality trends for males and females (United States: 1979–2009).

Go A S et al. Circulation 2013;127:e6-e245

Copyright © American Heart AssociationSlide15

Percentage breakdown of deaths attributable to cardiovascular disease (United States: 2009).

Go A S et al. Circulation 2013;127:e6-e245

Copyright © American Heart AssociationSlide16

Age-adjusted death rates for stroke by sex and race/ethnicity, 2009.

Go A S et al. Circulation 2013;127:e6-e245

Copyright © American Heart AssociationSlide17

Proportion of patients dead 1 year after first stroke.

Go A S et al. Circulation 2013;127:e6-e245

Copyright © American Heart AssociationSlide18

Proportion of patients dead within 5 years after first stroke.

Go A S et al. Circulation 2013;127:e6-e245

Copyright © American Heart AssociationSlide19

Risk

of CVD is increased by high blood pressure, poor diet, lack of exercise, and high cholesterol among other triggers.

Early warning signs of heart attack and stroke are also not recognized by most of the populationPeople with diabetes are 2-4 times more likely to die from heart disease or suffer a stroke.Having a heart attack or stroke increases the chances of a second one.Genetics

Risk Factors and Co-MorbiditiesSlide20

Estimated 10-year coronary heart disease risk in adults 55 years of age according to levels of various risk factors –(Framingham Heart Study).

Go A S et al. Circulation 2013;127:e6-e245

Copyright © American Heart AssociationSlide21

Estimated 10-year stroke risk in adults 55 to 84 years of age according to levels of various risk factors (Framingham Heart Study).

Go A S et al. Circulation 2013;127:e6-e245

Copyright © American Heart AssociationSlide22

Coronary Heart Disease alone costs the United States about $108.9 billion a year.

Stroke costs $54 billion a year.

There are additional costs associated with the long term disability and therapy to recover from stroke.Estimated CostsSlide23

Direct and indirect costs of cardiovascular disease (CVD) and stroke (in billions of dollars), United States, 2009.

Go A S et al. Circulation 2013;127:e6-e245

Copyright © American Heart AssociationSlide24

Projected total costs of cardiovascular disease (CVD), 2015–2030 (2010 $ in billions) in the United States.

Go A S et al. Circulation 2013;127:e6-e245

Copyright © American Heart AssociationSlide25

Projected total (direct and indirect) costs of total cardiovascular disease by age (2010 $ in billions).

Go A S et al. Circulation 2013;127:e6-e245

Copyright © American Heart AssociationSlide26

PreventionActivity, diet, weight loss, lower alcohol and tobacco use

Drug therapies

Thrombolytics, aspirinSurgical interventionsSome consequences of stroke or heart attack cannot be treated.TreatmentSlide27

Sponsored by National Heart, Lung and Blood Institute and Boston University

Started in 1948

Initially recruited 5209 adults aged 30-62Had not demonstrated symptoms of CVDHas continually monitored participants since then and added new cohorts.Determined many of the risk factors for CVDFramingham Heart StudySlide28

Long term outcomes of heart attack and stroke

Efficacy window for

thrombolyticsPrevention of diseaseImproved treatments and detectionFamilial riskhttp://clinicaltrials.gov/ct2/results?term=stroke&Search=Search

http://

clinicaltrials.gov/ct2/results?term=heart+attack+prevention&Search=Search

Ongoing ResearchSlide29

The American Heart Association’s major impact goal:

By 2020, to improve the cardiovascular health of all Americans by 20%, while reducing deaths from CVDs and strokes by 20%.

This will be measured using the seven risk measurements used to determine cardiovascular health.Healthy People 2020:Improve cardiovascular health and quality of life through prevention, detection, and treatment of risk factors for heart attack and stroke; early identification and treatment of heart attacks and strokes; and prevention of repeat cardiovascular events

ConclusionsSlide30

Prevalence of ideal, intermediate, and poor CV health metrics in 2006 (AHA 2020 Impact Goals baseline year) and 2020 projections assuming current trends continue. 2020 targets for each CV health metric, assuming a 20% relative increase in ideal CV health pr...

Go A S et al. Circulation 2013;127:e6-e245

Copyright © American Heart AssociationSlide31

http://apps.nccd.cdc.gov/DHDSPAtlas/viewer.aspx?state=MI

http://

www.who.int/mediacentre/factsheets/fs317/en/index.hmlhttp://www.who.int/cardiovascular_diseases/en

/

http

://

www.cdc.gov/stroke/risk_factors.htmhttp://www.cdc.gov/heartdisease/http://www.nhlbi.nih.gov/guidelines/cvd_adult/background.htmhttp://clinicaltrials.gov/ct2/results/browse?term=heart+disease&brwse=cond_alpha_hhttp://www.cdc.gov/nchs/data/hus/hus10.pdfhttp://circ.ahajournals.org/content/127/1/e6.figures-onlyhttp://www.cdc.gov/mmwr/preview/mmwrhtml/mm6040a1.htm?s_cid=mm6040a1_wReferences