/
Curriculum Standards for Elementary and Secondary Education: Curriculum Standards for Elementary and Secondary Education:

Curriculum Standards for Elementary and Secondary Education: - PowerPoint Presentation

kittie-lecroy
kittie-lecroy . @kittie-lecroy
Follow
343 views
Uploaded On 2019-11-04

Curriculum Standards for Elementary and Secondary Education: - PPT Presentation

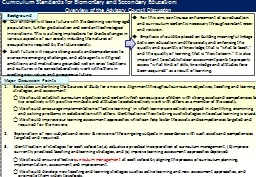
Curriculum Standards for Elementary and Secondary Education Overview of the Advisory Council Discussion Basic ideas underlining the Courses of Study for a new era Alignment throughout curriculum objectives teaching and learning strategies and ID: 763089

students age school high age students high school level 2013 learning schools education junior results ability japanese boys increase

Share:

Link:

Embed:

Download Presentation from below link

Download Presentation The PPT/PDF document "Curriculum Standards for Elementary and ..." is the property of its rightful owner. Permission is granted to download and print the materials on this web site for personal, non-commercial use only, and to display it on your personal computer provided you do not modify the materials and that you retain all copyright notices contained in the materials. By downloading content from our website, you accept the terms of this agreement.


Presentation Transcript

Curriculum Standards for Elementary and Secondary Education: Overview of the Advisory Council Discussion Basic ideas underlining the Courses of Study for a new era: Alignment throughout curriculum objectives, teaching and learning strategies, and assessment ○ We should establish curriculum objectives and content which can equip our children with strong assets and competencies to live creatively with positive mindsets and attitudes to collaboratively work with others as a member of the society. ○ We should encourage implementation of “active learning” in which learners are actively engaged in identifying, examining and solving problems in collaboration with others. Identification of how to bring such strategies into actual learning is crucial. ○ We should improve our learning assessment approaches which can help foster the assets and competencies targeted and required for the new era. Exploration of new subjects and review & revision of the on-going subjects in accordance with such assets and competencies targeted and required. Identification of strategies for each school to (a) actualize a practical incorporation of curriculum management, (b)improve currently practiced teaching and learning strategies, and (c) improve learning assessment approaches deployed.  ○ We should ensure effective curriculum management at each school by aligning the process of curriculum planning, implementation, assessment and improvement. ○ We should develop new teaching and learning strategies such as active learning and new assessment approaches, and promote them widely to schools. Major Discussion Points ◆ Our children will face a future with the declining working-aged population, further globalization and constant technological innovations. This is a strong implications for drastic changes in various aspects of our society including the natures of occupations required by the future society. ◆ Such future will require strong assets and competencies to overcome emerging challenges, and able agents with great ambitions and motivations grounded well on ones’ traditions and cultures who can collaboratively work with others in creating new values and prosperous future. ◆ For this aim, continuous enhancement of our education and curriculum content is necessary through constant review and revision. ◆ Emphasis should be placed on building meaningful linkage between education and the society, and enhancing the quality and quantity of knowledge, that is “what to teach,” and the quality of learning, that is “how to learn.” It is also important to establish clear assessment points to properly assess “what kind of skills, knowledge and attitudes have been acquired” as a result of learning. Background 0

1 Current Courses of Study

Changes to the Courses of Study 1958-1960Revision1968-1970 Revision1977-1978 Revision 1989 Revision 2 Clarification of the Courses of Study as a curriculum standard ( Establishment of moral education lessons, strengthening of basic academic ability, improvement of science and technology education, etc .)( Emphasis on systematic learning) ( Introduction ) Elementary Schools : FY1961; junior high schools : FY1962; high schools: FY1963 (phased in by grades) Further improvement (modernization) of the curriculum content(Introduction of the curriculum content compatible with modern advances)(Incl. introduction of set theory into arithmetic) (Introduction) Elementary schools: FY1971; junior high schools: FY1972; high schools: FY1973 (phased in by grades) Actualizing comfortable and fulfilling school environment, reducing the study load(Reviewing and reducing the subject objectives and content to the selected core items for each subject) (Introduction) Elementary schools: FY1980; junior high schools: FY1981; high schools: FY1982 (phased in by grades) Developing proactive attitudes and adaptabilities for social change(Establishment of living environment studies and enrichment of moral education) ( Introduction ) Elementary schools : FY1992; junior high schools : FY1993; high schools: FY1994 ( phased in by grades )

Changes to the Courses of Study ― cont.― 1998-1999 Revision2008-2009 Revision 2003 Partial Revision Actualization of the objectives articulated in the Courses of Study: Clarified that lessons can incorporation learning contents which are not stated in the Courses of Study. Added examples of individual learning with reference to some examples such as homogeneous grouping in elementary schools and supplementary/advanced learning in secondary schools. 3 Mastering of fundamentals and basics, development of “zest for living” through autonomous learning and thinking (Strict selection of the curriculum content, establishment of “period for integrated studies.” ) (Introduction) Elementary schools: FY2002; junior high schools: FY2002; high schools: FY2003 (phased in by grades) Development of “zest for living,” acquisition of basic and fundamental knowledge and skills, and balanced development of the ability to think, make decisions and express oneself(Increase in number of hours, enrichment of the curriculum content, introduction of foreign language instruction in elementary schools) (Introduction) Elementary schools: FY2011; junior high schools: FY2012; high schools: FY2013 (phased in by years)    ※Elementary and junior high schools introduced this revision early in FY2009, while high schools did so in FY2010.

  ( Reference: Report January 2008 - announced by the Central Council for Education) ○ The principle of fostering “zest for living” becomes more and more important in preparing ourselves for the on-going structural changes of the society that is called “knowledge-based society.”○ Five major issues can be identified in relation to the lack of feasible and practical strategies for actualizing the Courses of Study. (1) Information dissemination by the Ministry of Education to schools of the practical value and necessity of “Zest for Living” was not adequate, resulting in the lack of understanding and consensus at the school level. Teachers’ overemphasis on learner-centered approach resulted in their hesitation to provide necessary instructions and guidance. The linkage was not established effectively between skills and knowledge acquired in subject lessons and cross-cutting learning which could have been achieved in the period of integrated study. The number of class hours in the on-going curriculum is not enough to apply the basic skills knowledge acquired in each subject lesson to advanced learning activities such as scientific experiments, observations and report writing. Practical measures for backing up the weakened educational functions of families and communities were not adequately taken.Principles behind the Courses of Study Development of “Zest for Living,” which was the major point in the 1998-1999 revision, is considered equally or more important in the era of knowledge-based society. Revised Basic Act on Education clarified the principles of education, and the revised School Education Act sets out the important elements of academic abilities. The current Courses of Study follow this path, Aiming to foster “ Zest for Living .” 4     Zest for living Richness in mind Sound body Health and physical strength for living vigorously Solid Academic ability Cooperation and consideration combined with self-discipline, ability to be moved and impressed, etc. Mindset and ability for steadily acquiring the basics, identifying issues independently, learning and thinking independently, and voluntarily making judgments, taking action, and finding better solutions to problems.

(1) Basic ideas behind revisions Increase the number of class hours with the an emphasis on balancing the development of knowledge, skills, and thinking, decision making and self-expression abilities.Cultivate the “zest for living” in line with the principles clarified in the revised Basic Education Act and other related guidelines. Cultivate a rich and wholesome heart and body through solid moral and physical education ○ Increased class hours, by approx. 10 %, in Japanese, social studies, arithmetic, science, and P.E. classes  ○ Addition of class hours per week: 2 classes per week in the lower grades, and 1 class per week in the middle & upper grades (2) Increase in the number of class hours (elementary & junior high school ) ○ Increased class hours, by approx. 10 %, in Japanese, social s tudies, arithmetic, science, foreign language, and health/P.E. classes○ Addition of 1 class per week in each grade Junior high school Elementary school 5 Major Points of the Revision in the Course of Study(March 2008/2009 Revision) Lesson design to be shifted to incorporating active language activities by learners, not by teachers (3) Enriched language activities

○  School Education Act (1947 Act No. 26) Article 30. […] ② Elementary school education shall endeavor to cultivate the foundation for life-long learning of learners, giving particular considerations to; (1) developing basic and fundamental knowledge and skills, (2) fostering the ability to think, to make decisions and to express themselves in order to apply acquired knowledge and skills, and (3) cultivating positive and proactive attitude toward learning.○ Course of Study for Elementary Schools (2008, MEXT Notification No. 27)  ※ There exist similar notifications for junior high schools, high schools and schools for special needs education. Chapter 1 General Provisions 1. General Policies Regarding Curriculum Formulation  1 […] In providing educational activities, each school should create specifically tailored educational activities by making use of originality and ingenuity, in order to foster in pupils a zest for life. In doing so, each school should be committed to enhancing its instruction to enable pupils (1) to solidly acquire basic and fundamental knowledge and skills, (2) to foster the ability to think, to make decisions, to express themselves and other abilities that are necessary to solve problems by using acquired knowledge and skills, (3) to cultivate an attitude of proactive learning and to develop pupils’ individuality. In working toward these goals, each school should enhance its pupils’ language activities, giving consideration to the developmental stages of the pupils, and in cooperation with pupils’ homes at the same time, consideration should be given to help pupils establish good learning habits.  Three Elements of Academic Abilities: As Defined in the School Education Act 6

7 Changes in the Society and Current State of our Children

Population Projections - Japan ◆ Aging population and low birth rate will continue, resulting in a severe decline in the entire population by 30% within the next 50 years. By then, the population aged 65 and over will be 40% of the entire population. (Sources)Data Prepared by the MEXT based on the JAPAN STATISTICAL YEARBOOK 2014 issued by the Statistics Bureau (Ministry of Internal Affairs and Communications)8Millions 0-14 yrs 15-64 yrs 65+ yrs (Juvenile) (Working age) (Aging) 1920 ‘25 ’ 30 ‘ 35 ’40 ’45 ’50 ‘55 ’60 ‘65 ’70 ‘75 ‘80 ’85 ‘90 ’95 ‘99 2000 ‘01 ’00 ’01 ‘02 ’03 ‘04 ‘05 ‘06 ‘07 ‘08 ‘09 ‘10 ‘11 ’12 ‘13 ‘18 ‘23 ‘28 ‘32 ’42 ‘47 ’57 ‘67 ’77 ’87 ‘97 0Decline 30% 40 % of the Population is aged 65 and over.

81.73 million 44.18 million(Thousand)Projection of Working-Age Population◆The working-age population is dwindling, and by 2060 is estimated to be only the half of the working-age population recorded in 2010. ( Sources)Data Prepared by MEXT based on the Population Projection for Japan issued by the National Institute for Population and Social Security Research in January 2008. Original data excerpted from the table 1-1: total population, population and percentage per age group (0-14, 15-64, 65+) based on medium-variant fertility and mortality projections. Half of the Working-age Population in Year 2010(81.73 million) 9 Under 15 yrs old Working-age (15 - 64 yrs old) Aging (65 and over)

( Year ) ( Average Score ) Transition of Japan’s Average Scores and Ranking Japan’s PISA Results ― Transition of Average Scores and Ranking ― ◆ The Japan’s 2012 PISA result in the three core domains, namely mathematical literacy, reading literacy and scientific literary, hits the highest in its past comparable PISA results. ( Sources) Data Compiled by MEXT and National Institute for Educational Policy Research (NIER) 10 Mathematical Reading Scientific ※PISA Study : International student a ssessment of 15-year-old students by OECD (1 st year high school students are surveyed in Japan) ※Below are the Japan’s ranking among all OECD countries participating in PISA (Inside the brackets are the rankings among all participating countries). ※For mathematical and scientific literacy results, the results are those from the past consecutive years comparable to that of 2012. Reading Literacy Mathematical Literacy Scientific Literacy 522 pts 8 th /28 (8 th /32) 498 pts 12 th /30 (14 th /41) 498 pts 12 th /30 (15 th /57) 520 pts 5 th /34 (8 th /65) 538 pts 1 st /34 (4 th /65) 534 pts 4 th /30 (6 th /41) 523 pts 6 th /30 (10 th /57) 529 pts 4 th /34 (9 th /65) 536 pts 2 nd /34 (7 th /65) 531 pts 3 rd / 30 (6 th /57) 539 pts 2 nd /34 (5 th /65) 547 pts 1 st /34 (4 th /65) ※ Scores for each respective year are computed based on the OECD average scores recorded in the following years (reading-2000, math-2003, scientific- 2006) in which a particular literacy domain was assessed as a core domain.

Japan’s PISA Results ― Changes in the Percentages of Students by Proficiency Levels ― ◆ Comparison of the PISA results in the past years, based on proficiency levels, shows a decline in the percentage of students in Level 1 and below, and positive increase in those in Level 5 and above from 2009 to 2012.        In 2012 PISA, the percentage of students in Level 1 and below is the lowest of all the 7 levels. That in Level 5 and above shows significant increment from 2006 to 2012.Mathematical LiteracySignificant increment from 2006, 2009 to 2012. ※Levels set in PISA studies slightly differ in some years . For a comparison purpose, they are categorized as follows. Level 1 = Level 1a, Below Level 1 = Level 1b and below, Level 5 and Above = Level 5 + Level 6 and above. Significant increment from the 2003 result to the latest Significant decline from the 2006 result to the latest Significant decline from the 2006 result to the latest Changes in the % of Students By Proficiency Levels 11 ( Sources) Data from “Points in OECD PISA 2012” c ompiled by MEXT and National Institute for Educational Policy Research ( NIER)         In 2012 PISA, the percentage of students in Level 1 and below declined , going back to that of PISA 2000. The percentage of students in Level 5 and above in 2012 PISA is higher than the previous PISA results of the same proficiency levels. Reading LiteracyIn 2012 PISA, the percentage of students in Level 1 and below is the lowest since 2006. That in Level 5 and above is the highest since 2006. Scientific Literacy% of Student % of Student % of Student Below Level 1 Level 1 Level 2 Level 3 Level 4 Level 5 Above Level 5 OECD Ave. OECD Ave.OECD Ave.Below Level 1 Level 1 Level 2 Level 3 Level 4 Level 5 Above Level 5 Below Level 1 Level 1 Level 2 Level 3 Level 4 Level 5 Above Level 5

Closing Score Gap between the national average and the scores of the lower-scoring prefectures ―Based on the Results from Japan’s National  Assessment of Academic Ability ―◆ The gap between the average scores of the selected three lower-scoring prefectures (public schools) and the national average has been shrinking in the past years; implications for a strengthened academic abilities. 【Elementary School】【 Junior High School】Average of Three higher-scoring prefecturesAverage of Three lower-scoring prefecturesAverage of Three lower-scoring prefectures Average of Three higher-scoring prefectures (Sources) “2014 Japan’s National Assessment of Academic Ability Results (summary)” issued by MEXT and NIER※3 higher-scoring prefectures and lower-scoring prefectures (Below data is based on the average scores of the three lower-scoring prefectures and higher scoring prefectures (public schools) in the 2009, 2013 and 2014 assessments. Transition of Average Scores ( Gap with the Nat’l Average) 12 Japanese A Japanese B Japanese B Math A Math B 2009 2013 2014 Japanese A Japanese B Math A Math B 2009 2013 2014

◆ While the students’ overall academic abilities show improvement, issues remain with their ability to explain one’s ideas and opinions referring to the underlying rationale or logic. <Japanese>In regards to an ability to discuss with others clarifying one’s standpoint and rationale or logic, students can demonstrate an ability to express one’s opinions maintaining a certain standpoint. However, they still have a weakness in presenting underlying rationale when explaining one’s opinions.  <Mathematics>Students are weak in identifying quantitative relations based on pictures and diagrams given and in understanding pictures and diagrams which represent certain quantitative relations. In comparing the sizes of numbers, students demonstrate improvement in an ability to explain logic behind one’s answers by properly presenting related information and data. They still have some remaining challenges on this aspect. <Japanese>In expressing one’s opinion, students can try to present rationale or logic while they have a weakness in fully understanding and effectively utilizing related information and reasons in presentations.In regards to an ability to identify and use necessary information from readings or documents and write one’s thoughts by making clear statements and logic, students can identify necessary information from readings and documents, but they still have a weakness in making use of such information and explaining one’s ideas and opinions properly. <Mathematics> In descriptive sentence problems, students have weaknesses in describing reasons on probability problems, and explaining a way of solving problems with the use of graphs. In regards to geometric proof problems, students can accurately identify relevant geometric figure(s) while they have a weakness in planning and writing proofs. Elementary School Junior High School 13 ( Sources ) “2014 Japan’s National Assessment of Academic Ability Results (summary)” issued by MEXT and NIER Subject-wise Issue Analysis: Cases of Japanes e and Mathematics ― Based on the Results from Japan’s National  Assessment of Academic Ability ―

◆ Japanese junior high school students’ results are lower than the international average in regards to motivation for learning and practical use of knowledge and skills acquired to one’s real life situation. Students’ Perception toward Math and Science ―TIMSS 2011 Students Questionnaire Results―MathScience Japan Int’l Average JapanInt’l Average I enjoy learning mathematics /science. 48% 71% 63% 80% I think learning mathematics/science will help me in my daily life. 71% 89% 57% 83% I need mathematics /science to learn other school subjects. 67% 81% 35% 70% I need to do well in mathematics /science to get into the college or university of my choice. 72% 85% 59% 77% I need to do well in mathematics /science to get the job I want. 62% 83% 47% 70% I would like a job that involves using mathematics /science. 18% 52% 20% 56% (Sources ) Data Prepared by MEXT based on the TIMSS2011 Student Questionnaire Results ※The percentages shown below are based on the number of students who answered “agree a lot” and “agree a little” for each question. ( students surveyed: 2 nd Year junior high school students) 14

◆ Compared to students in USA, China and South Korea, Japanese students answered negatively in self-esteem and social participation-related questions: the number of Japanese students who answered positively to the question “I am a person of value” is less than 50 %, and it is equally low for the question “My involvement and participation may be able to change the society.” Students’ Self-esteem and Social Participation Levels(Sources)Data based on Survey Report on Living Consciousness and Perception toward Studying Abroad of High School Students (April 2012) prepared by Hitotsubashi Bungei Kyoiku Shinkokai and Japan Youth Research Institute Japan USA China South Korea Japan USA China South Korea 15 【Question 33-2 】   My involvement and participation may be able to change the society even a little. ( Sources) Data prepared based on Survey Report on Lives and Perceptions of Japanese J unior High and High School Students – Comparative Analysis of Japan, USA, China and South Korea (February 2009) issued by Hitotsubashi Bungei Kyoiku Shinkokai and Japan Youth Research Institute Junior High School StudentsHigh School StudentsMy Personality Assessment (high school students) I am a person of valueI am not a valuable personKoreaChinaUSAJapan Korea China USA Japan ① Strongly agree ③ No so much ② Agree to some extent ④ Disagree ① Strongly agree ③ No so much ② Agree to some extent ④ Disagree

Perception of Youth toward Social Rules and Moral ◆Data shows that Japanese youth tend to have strong consciousness that they should not cause troubles to others. On the other hand, they show passiveness and lower interest in helping others or being involved in volunteer activities. ※Males and females aged 13 – 29 yrs old were surveyed. “We can do whatever we want as long as we do not cause troubles to others.” [Total % of students answering “agree” and “moderately agree]16AgreeModerately agreeAgreeModerately agreeJapanSouth KoreaUSAUK GermanyFrance SwedenJapanSouth KoreaUSAUKGermany France SwedenJapanSouth KoreaUSAUK Germany France Sweden (Sources) Survey on Perception of Youth in Japan and Other Nations, issued by the Cabinet Office, Government of Japan Yes, I am interested. “We should help those who are in trouble even when they do not ask for help.” [Total % of students answering “agree” and “moderately agree] “Are you interested in volunteer activities?” [Total % of students answering “Yes”]

Promoting critical thinking Fostering students’ confidence in studyingPromoting motivation of students with no interestsEncouraging students to find the importance and value of learning Giving students tasks which require at least one week to explore Giving students tasks according to their understanding levelsIncorporating group-based problem solving activitiesEncouraging students’ use of ICT in lesson and various school activities JapanAverageJapanAverageIssues Surrounding the Proactive Learning – Results from OECD Teaching and Learning International Survey (TALIS) – ◆While teachers acknowledge the importance of fostering students’ proactive learning, they tend to show low confidence in actualizing it in their teaching. The percentage of teachers using a variety of teaching methods including uses of ICT in lessons is also low. Teachers confident in bringing about students’ proactive learning(Sources) OECD TALIS 2013 Results : executive summary 17 Teachers regularly utilizing various teaching methods in their teaching as described below

①Number of students per computer ( students/computer)H25年3月1日現在 ② Number of electric whiteboards in school Increase of 10,360 electric whiteboards within one year from 2013 to 2014 6,894 7,832 9,536 12,544 16,403 42,184 64,356 82,528 ( Unit:10,000 ) 60,478 H26 年 3 月 1 日現在 72,168 ◆ The number of students per computer available in school continues to be flat in the last few years. Installation of electric whiteboards shows increase every year. (Sources) Data from 2015 MEXT Survey on School Uses of ICT in Education Transition of ICT Environment in School 18 As of March 1, 2014 As of March 1, 2014 March 1, 2013 2005 2006 2007 2008 2009 2010 2011 2012 2013 2014 March March … 2005 2006 2007 2008 2009 2010 2011 2012 2013 2014 March March …

(%) ※The results above are based on the average of the number of teachers who answered “can do mostly” and “can do to some extent” on the ICT skill checklist. (Sources) Data from 2015 MEXT Survey on School Uses of ICT in Education ◆The percentages of teachers who can use ICT in their teaching and instruct pupils how to use ICT are gradually increasing; however, it is still not sufficient. Teachers’ Abilities to Use and Teach ICT19Ability to use ICT in teaching Ability to instruct pupils how to use ICT 2008 2009 2010 2011 2012 2013 2014March

■ Students who reach the target level of English proficiency are approximately 32 % in case of junior high school (3rd year students) and 31 % in case of high school (3rd year students). ○ Upon completion of the junior high school course: To understand the speaker’s intentions through listening to or reading basic English and express one’s own opinions and thoughts by using basic English (equivalent of the Society for Testing English Proficiency (STEP) Grade 3 and higher)○ Upon completion of the high school course: To accurately understand and appropriately convey information, ideas, etc. (equivalent of the STEP Grade Pre-2 ~Grade 2)■ English teachers who have the target level of English proficiency are, in public junior high schools, approximately 28 %, and in public high schools, 53 %. ○ In order to develop students’ communication abilities in English, to ensure opportunities for students to be exposed to English and use English in classes for practical communications.   (equivalent of the STEP Grade Pre-1 and higher, TOEFL PBT 550 and higher /CBT 213 and higher / iBT 80 and higher / TOEIC 730 and higher)■ English teachers who conduct English lessons with 50 % or more English are, in public junior high schools, approximately 41 %, in public high schools (for lessons “Communication English Ⅰ” for 3rd year students), 53 %. ■ Public schools that set learning attainment targets by applying the “CAN-DO list” are, in public junior high schools, approximately 17 %, and in public high schools, 34 %. ○ “CAN-DO List” are a document each school is supposed to develop by describing what their students should be able to do by using English.            (Sources) 2013 Survey on the English Language Education prepared by MEXT       The Current State of English Education 20

Boys :Comparison of the physical growth of Japanese boys measured both in 1948 and 2013 shows that the most significant increase in height begins earlier for boys in 2013. Age 14-15 (1948)→Age 12-13 (2013)Transition of Pupils’ Average Height and Weight (Sources) School Health Statistics 1948 and 2013【Boys】Increase(cm)Height(cm) 【 Girls 】 Increase (cm) Height (cm) 【 Boys 】 Increase (kg) Weight (kg) 【Girls】 Increase (kg) Weight (kg) ◆ Japanese children’s physical growth (height & weight) begins earlier than the past by approximately 2 years. 21 Increas e (in 2013) [left scale] Increase (in 1948) [left scale] Height (in 2013) [right scale] Height (in 1948) [right scale] Increas e (in 2013) [left scale] Increase (in 1948) [left scale] Height (in 2013) [right scale] Height (in 1948) [right scale] Increas e (in 2013) [left scale] Increase (in 1948) [left scale] Weight (in 2013) [right scale] W eight (in 1948) [right scale] Increas e (in 2013) [left scale] Increase (in 1948) [left scale] Weight (in 2013) [right scale] W eight (in 1948) [right scale] Boys : Comparison of the physical growth of Japanese boys measured both in 1948 and 2013 shows that the most significant increase in weight begins earlier for boys in 2013. Age 14-16 (1948) → Age 12-15 (2013) Girls : Comparison of the physical growth of Japanese girls measured both in 1948 and 2013 shows that the most significant increase in height begins earlier for girls in 2013. Age 11-13 (1948) → Age 10-11 (2013) Girls : Comparison of the physical growth of Japanese girls measured both in 1948 and 2013 shows that the most significant increase in weight begins earlier for girls in 2013. Age 12-15 (1948) → Age 11-12 (2013) 5 6 7 8 9 10 11 12 13 14 15 16 17 (age) 5 6 7 8 9 10 11 12 13 14 15 16 17 (age) 5 6 7 8 9 10 11 12 13 14 15 16 17 (age) 5 6 7 8 9 10 11 12 13 14 15 16 17 (age)

〇 Annual Transitions 【Second】【meter】50 Meter Dash Sof tball Throw (Sources) 2013 Survey on Physical Fitness and Motor Ability issued by MEXT19851993 1998200320082013 Boys Age 7 10.30 10.52 10.78 10.83 10.65 10.61 Girls Age 7 10.68 10.72 11.02 11.01 11.08 10.93 Boys Age 99.40 9.48 9.68 9.75 9.65 9.67 Girls Age 99.74 9.74 9.95 9.99 9.93 9.98 Boys Age 118.75 8.76 8.93 8.91 8.88 8.90 Girls Age 11 9.00 9.08 9.26 9.25 9.23 9.12 198519931998200320082013 Boys Age 715.37 13.96 13.36 12.37 13.25 12.38 Girls Age 78.80 8.27 7.94 7.61 7.73 7.64 Boys Age 925.13 22.52 22.06 21.42 22.33 20.33 Girls Age 914.22 12.77 12.64 12.31 12.50 11.92 Boys Age 1133.98 31.73 29.77 30.42 30.37 28.41 Girls Age 11 20.52 17.55 17.49 17.19 17.87 16.85 Transition of Children’s Physical Fitness and Motor Ability◆Children’s physical fitness shows lower results compared to the results recorded around 1985. 22 Boys Age 7Girls Age 7 Boys Age 9Girls Age 9Boys Age 11Girls Age 11 Boys Age 7Girls Age 7 Boys Age 9Girls Age 9Boys Age 11Girls Age 11 1985 1993 1998 2003 2008 2013 1985 1993 1998 2003 2008 2013

Comparison of Physical Fitness and Motor Abilities: Children and their Parents’ Generation◆ Physique of current children shows improvement compared to that of their parents’ generation. However, the physical fitness and motor ability show lower results. 〇Comparison with the Parents’ Generation (30 years ago) <Physique><Results> ※ Improvement shown in Jumping side to side (Sources) 2013 Survey on Physical Fitness and Motor Ability issued by MEXT (Sources) 2013 National Survey on Physical Fitness, Motor Abilities and Exercise Habits by MEXT Male junior high s chool students Height ( cm ) 1983 2013 Boys Age 11 143.1 145.0 Girls Age 11 145.2146.8Weight(kg) 19832013Boys Age 1136.538.3Girls Age 1137.739.0 50 meter dash (second)19832013Boys Age 118.708.90Girls Age 118.989.12Softball throw (m) 19832013Boys Age 1134.4728.41Girls Age 1120.4716.85Grip strength (kg) 19832013Boys Age 1121.6020.04Girls Age 1119.8119.74Jumping side to side (times)1983 2013Boys Age 1142.6545.79Girls Age 1140.5043.02◆ There is a polarization between children who actively engage in physical exercise and those who do not. 23Female junior high school students Time spent for physical exercise wasless than 60 min a week.9.7 %Time spent for physical exercise wasless than 60 min a week.29.9 % (min)(min)

( Reference )Exa mples of Active Learning Practiced in Elementary and Secondary Education Schools carry out special lessons on Saturday by inviting guest teachers, who are volunteers from local companies, community people and parents. Students learn about their knowledge and skills from such people through various unique learning activities. Enriching Language Activities Active Use of ICT Fostering School-Family-Community Collaboration through Utilization of External Resources (Right) Ecological handicraft w orkshop as part of Environmental Education Students observe the mechanisms of simple air guns and how a sponge ball   flies out, and describe their ideas in charts. Teacher snapshots the students’ work with her tablet computer and presents it to the class on an electric whiteboard. Students, in a plenary session, go over different ideas from classmates, categorize similar ideas, or make comparison with one’s own. Diagram excerpted from Prof. Nahomi Miyake’s session material for the m eeting on education objectives, contents and assessment for developing target competencies and abilities (5th meeting) (Picture Below) Group presenting the roots of Japanese old tales they researched Examples of Japanese Lessons This is a group activity in which students go over related documents about their favorite traditional tales, do research on their roots, compile the results and present to the class. They also express their thoughts and findings while listening to other groups’ presentation. Examples of Science Lessons (Left) Class reviewing and comparing various ideas Thi s is a group activity in which students set some approaches to solve a presented problem, assign group members to each approach, integrate ideas from members through discussion, and find their answer. Groups present to the class their answers and rationale for further discussion, which contributes to deepening the ideas. (Example of Jigsaw Theory) Active Use of Pair and Group Learning (Left) Students presenting their ideas and discussion in groups by using computers. 24 Effective u se of ICT such as tablet computers and electric whiteboards can not only help students better understand lessons but also contribut e to active learning of each student when effectively used for individual learning and group learning. Knowledge-Constructive Jigsaw Method Experts ⇒ Jigsaw Part A Part B Part C Problem Integrate the 3 separate parts to solve the problem