/
How extreme can a solar storm become How extreme can a solar storm become

How extreme can a solar storm become - PowerPoint Presentation

kittie-lecroy
kittie-lecroy . @kittie-lecroy
Follow
400 views
Uploaded On 2016-10-21

How extreme can a solar storm become - PPT Presentation

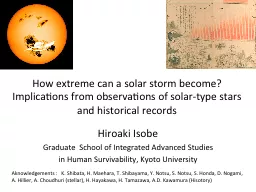
Implications from observations of solartype stars and historical records Hiroaki Isobe Graduate School of Integrated Advanced Studies in Human Survivability Kyoto University Aknowledgements ID: 478729

flare solar notsu 2013 solar flare 2013 notsu stars pasj 2012 records stellar brightness 2014 period aurora type maehara

Share:

Link:

Embed:

Download Presentation from below link

Download Presentation The PPT/PDF document "How extreme can a solar storm become" is the property of its rightful owner. Permission is granted to download and print the materials on this web site for personal, non-commercial use only, and to display it on your personal computer provided you do not modify the materials and that you retain all copyright notices contained in the materials. By downloading content from our website, you accept the terms of this agreement.


Presentation Transcript

Slide1

How extreme can a solar storm become

?

Implications from observations of solar-type stars and historical records

Hiroaki IsobeGraduate School of Integrated Advanced Studies in Human Survivability, Kyoto University

Aknowledgements

: K. Shibata, H.

Maehara

, T.

Shibayama

, Y.

Notsu

, S.

Notsu

, S. Honda, D.

Nogami

, A. Hillier, A.

Choudhuri

(stellar), H. Hayakawa, H.

Tamazawa

,

A.D. Kawamura (

Hisotory

)Slide2

Carrington flare

(1859, Sep 1, am 11:18 )

The first record of flare observation by Richard Carrington in 1859Estimated to be the largest flare/magnetic storm. DST ~ -1760nT, total energy ~

1032-33 ergs (Tsurutani+2003) Terrestrial impacts:

B

right aurora appeared next day in Cuba, the Bahamas, Jamaica, El Salvador, and Hawaii.

Telegraphy systems in Europe and North America failed

F

lare on

2012 July 23 observed by STEREO

may have been super-

carrington

.

Slide3

Super Flare

in solar-type stars?Schaefer et al. (2000, ApJ) reported 9 superflares

(E>1033-38 erg) on ordinary “solar type stars”, namely the spectral class of F8-G8, single, not rapid rotator, not very young. Interpretation: magnetic interaction with a hot Jupiter because no historical records

=> Search of for super flares in solar type stars by KeplerSlide4

F

ound many of them(Maehara et al. 2012 Nature; Shibayama et al. 2013 ApJS)

Among 80,000 G-type stars, 1574 superflares (E~10

34-36 ergs) found in 279 stars.No signature of hot Jupiters in superflare stars

Maehara

et al. (2012)

Spectroscopic observation shows at least two stars are really solar-

twins (

T

eff

~ 5700K,

rotational period 21.8d / 25.3d)

(

Nogami

et al. 2014 PASJ)Slide5

Observation details

Kepler satellite (launched in 2009)Optical (400-850nm) telescope with 95cm aperture

Main science target; exoplanets hunting by transit method Accurate photometory (~10-5

for 12 mag star)Time resolution 30min or 1minData selection and flare detection5100K < Teff

< 6000 and log g > 4.0 => ~80,000 stars

Automatic detection of sharp intensity increase => visual inspection of

lightcurves

/images to remove suspicious events

Detection limit ~ 0.1-1% of average brightness ~ 0.5-5x10

34

erg

Assume T~10,000K black body to estimate flare energy

More detail in

Shibayama+2013,

ApJSSlide6

Periodic brightness

modurationRotation of big spots?

Maehara

et al 2012Slide7

Model calculation of stellar brightness variation

KIC6034120

2

(

平均基準

)

model(green)

inclination = 45°

Starspot

radius

0.16 R*

5 days

Notsu

et al.

time

Stellar

brightnessSlide8

KIC6034120

2

(

平均基準

)

5 days

Notsu

et al.

Model calculation of stellar brightness variation

model(green)

inclination = 45°

Starspot

radius

0.16 R*

time

Stellar

brightnessSlide9

KIC6034120

2

(

平均基準

)

5 days

Notsu

et al.

Model calculation of stellar brightness variation

model(green)

inclination = 45°

Starspot

radius

0.16 R*

time

Stellar

brightness

Rotational period and sunspot area can be estimated.

Rotational period calculated by this method consistent with

v

sin

i

obtained by spectroscopy (

Notsu

et al. 2015 PASJ)Slide10

Flare energy

vs rotational period

Stars w

ith period longerthan 10 dayscf solar rot period ~ 25days

Maehara

et al. (2012)

Fast rotation

(young)

Slow

rotation

(old)Slide11

Supectroscopic

observations by SUBARU telescope(Nogami et al. 2014, Notsu et al. 2015a,2015b, Honda et al. 2015, all in PASJ)

High dispersion spectroscopy of 50 supar-flare stars34 shows no evidence of binary

Measured Teff, g, vsini, metalicity

,

chromospheric

activity (depth of

CaII

infrared triplet)

v

sin

I

Rotationa

l

velocity calculated from

Kepler

light curve

T

eff

and g are also

consitent

with the

Kepler

catalogue are also

Notsu

et al. 2015bSlide12

Chromospheric

activity and <fB> probed by CaII infrared (8542Å) triplet(Notsu et al. 2015b PASJ)

r

0

Solar observation (

Hida

observatory)

Some slowly rotating

superflare

stars seem to have strong average B

~ size of spotsSlide13

superflare

nanoflare

microflare

solar flare

Comparison of statistics between

solar flares/

microflares

and

superflares

Largest solar flare

Shibata et al. 2013Slide14

superflare

nanoflare

microflare

solar flare

Comparison of statistics between

solar flares/

microflares

and

superflares

1000 in 1 year

100 in 1 year

10 in 1 year

1 in 1 year

1 in 10 year

1 in 100 year

1 in 1000 year

1 in 10000 year

Largest solar flare

Superflares

of 1000 times more

Energetic than the largest solar

flares occur once in 5000 years

Shibata et al. 2013Slide15

Can super flares occur in our Sun?

(Shibata, Isobe, Hillier et al. 2013 PASJ)

Largest e

nergy of a flare ~ a fraction of total magnetic energy in active region

Need a big spot. Magnetic flux

BA

spot

~ 10

24

Mx

.

Comparable to the total flux generated in 11 year cycle.

Non-standard scenario such as

radiative

zone-core dynamo?Slide16

Impact of 10^35 erg

superflaresEnergetic particles produce NOx in the upper atmosphere and cause Ozone depletionIf solar energetic particle (SEP) intensity proportional to flare energy (which seems unlikely… e.g. Usoskin

et al. 2013);Radiation intensity on the ground will be ~40mSvAll astronauts and some of airline passengers may be exposed to fatal radiation (> 4000 mSv)Almost all artificial satellites dieRadio communication trouble and blackout would occur all over the planet.

Segura et al. 2010Slide17

Historical evidence 1:

cosmogenic radionuclides Sharp increase of

14C in tree rings records (Miyake et al. 2012 Nature, Miyake et al. 2013 Nature Comm.)

Evidence also found in 14C of other trees (Usoskin+2013; Jull+2014; Güttler+2013

)

, corals (Liu+2014) and

10

Be in

antarctic

ice core (Miyake+2015).

But no evidence in Greenland

10

Be

(

Yiou+1997

;

Berggren+2009

; Usoskin+2013)

14

C production rate ~ 10

8

atoms

/

cm

2

/

yr

.

Require

X230 (~9x10

33

ergs)

flare

(Cliver+ 2014)Slide18

Any records in

historical literature?“This year (774) also appeared in the heavens a red crucifix, after sunset; the

Mercians and the men of Kent fought at Otford; and wonderful serpents were seen in the land of the South­Saxons.” Allen (2012)There also is and German records on “Red shield-like thing above the church” [

Annales Regni Francorum: 776]In China (776):「大曆十年

十二月丙子

Jan 12, 776)

,月出東方,上有

白氣

十餘道,如匹練,貫五車及畢、觜觿、參、東井、輿鬼、柳、軒轅,中夜散去」

[

新唐書天文二

]

Pioneering works of the survey of aurora observation in Chinese, Korean and Japanese literature by

Keimatsu

(1973) and

Yau

(1995)

Association with the AD775 event pointed out by Allen (2012),

Usoskin

(2013),

Cliver

+(2014)

Red aurora in Japan (1770)

National

Diet Library of

Japan Digital

archiveSlide19

Advantage of Chinese chronicles

Continuous and systematic observation by experts (astronomers) conducted by the central government of each dynasty and summarized in “Astronomical Treatise(天文誌) Date and place of the observations clearly recorded, often with information of time (day or night), direction, shape, and colors.

Recorded in (apparently) objective style

And now there is a digitized database! Slide20

Sunspots and aurora records during Song dynasty (960

–1279)(Hayakawa, Tamazawa, Kawamura & Isobe, Earth, Planets and Space in press.)

Sunspots are recorded as “black spots 黒子” or “black vapors(黒気)” inside the Sun.

Some description of size and shapes. e.g., “peach” “plum” “chichen egg” “duck egg”Aurora candidates are “vapors” with

various

colots

. Among 193 auroral

candidates, 75

are

white, 58

are

red

,

28

are blue-white

. The other

32 include yellow, blue gold

etc.

year

number of eventsSlide21

AD 994 event?

Points : 14C(

Miyake+2013)Bar : aurora (total)No sunspot records during 985-1004 (there is one in 1005)

Hayakawa et al. EPS in press.Slide22

Summary

Many super flare (E~10 34-35 ergs) found in G-type stars.Some of super-flare stars look solar-twins (spectral type, rotational period, age, metalicity etc)

Some evidence of extreme cosmic-ray event in cosmogenic radionuclidesSurvey of aurora/sunspots in historical records ongoing. Table will be provided online for scientific communityEuropean collaborators welcome!Slide23
Slide24

References

Discovery and statistics (Maehara et al. 2012 Nature; Shibayama et al. 2013 ApJS)Theory (Shibata et al. 2013, PASJ)

Supectroscopy by SUBARUDiscovery of solar twins (Nogami et al. 2014 PASJ)Teff,

g, matalicity, vsini (Notsu

et al.

2015a, PASJ)

Stellar rotation,

starspots

,

chromospheric

activities (

Notsu

et al. 2015b, PASJ)

Li abundances

(Honda et al. PASJ in press,

arXiv 1505.06050)

G, K, and M

dwarfs

(

Candelaresi

et al. 2014

ApJ

)

Temporal variation by 1-min cadence

Kepler

data (

Maehara

et al. 2015 Earth, Planets and Space)

Historical records (Hayakawa,

Tamazawa

, Kawamura & Isobe, Earth, Planets and Space

Earth, Planets and Space 2015, 67:82)Slide25

Note on cosmic ray events

10 Be are more sensitive to short-term variations than 14C the atmospheric residence time. 14C is ~8 years and 10Be is 1–2 yearsBut 10Be deposition is also easily affected by climate noiseAD775 event detected in Dome Fuji ice core, but not from quasi-decadal data of the Greenland ice core (

Yiou et al., 1997; Berggren et al., 2009; Usoskin et al., 2013)10Be sharp increase

found in annual data of 10Be in Dome Fuji ice core

, but

its

amplitude

is

uncertain

(Miyate+2015 GRL)