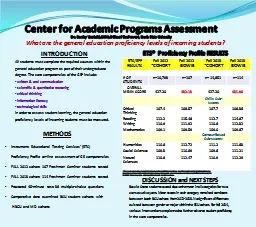
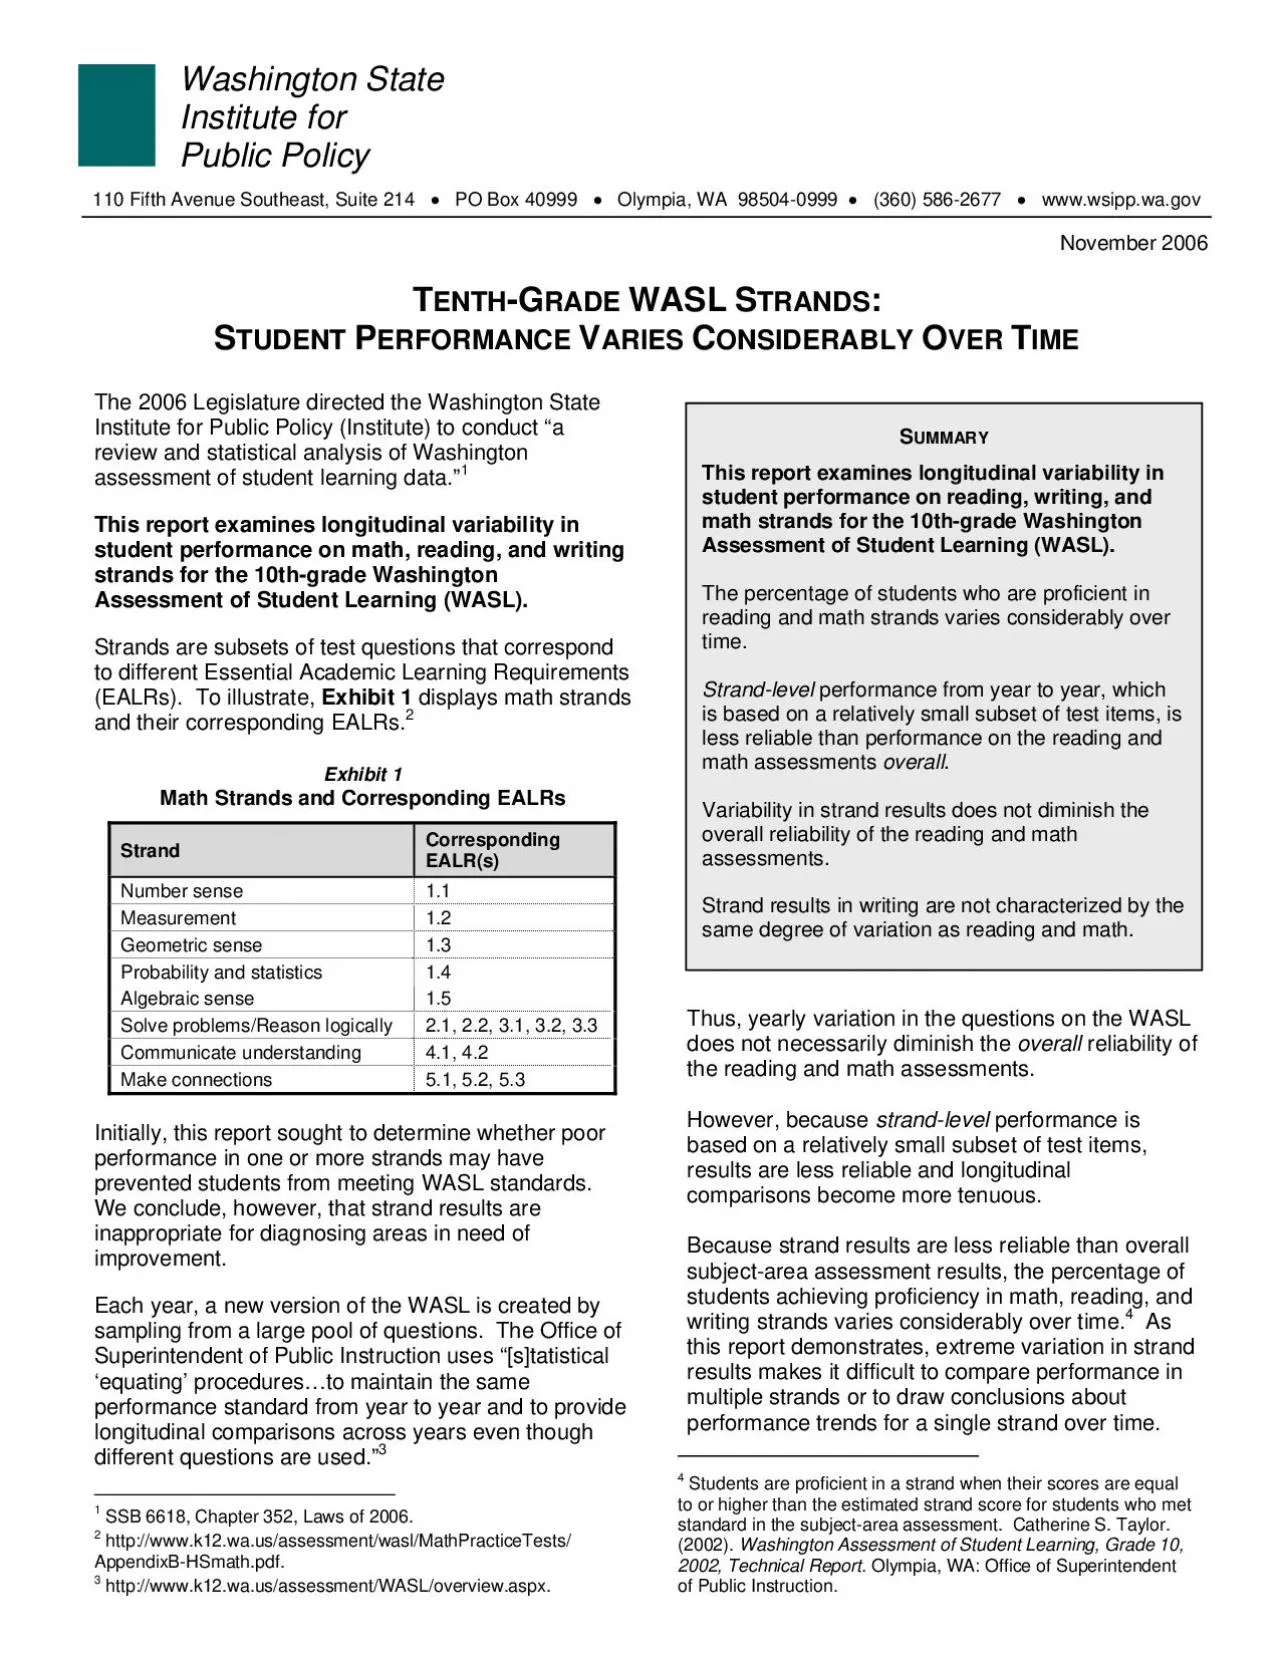
/
ATH TRAND students who achieved proficiency in eight math strands on t ATH TRAND students who achieved proficiency in eight math strands on t

ATH TRAND students who achieved proficiency in eight math strands on t - PDF document

kylie
kylie . @kylie
Follow
342 views
Uploaded On 2021-09-30

ATH TRAND students who achieved proficiency in eight math strands on t - PPT Presentation

19992000200120022003200420052006Content 1Content 2Content 3Content 4Content 5Process 1Process 2Process 3Content 1 Number Sense Content 2 Measurement Content 3 Geometric Sense Content 4 Probability ID: 891029

content strand proficiency strands strand content strands proficiency reading students math percentage process 2006 performance year writing wasl results

Share:

Link:

Embed:

Download Presentation from below link

Download Pdf The PPT/PDF document "ATH TRAND students who achieved proficie..." is the property of its rightful owner. Permission is granted to download and print the materials on this web site for personal, non-commercial use only, and to display it on your personal computer provided you do not modify the materials and that you retain all copyright notices contained in the materials. By downloading content from our website, you accept the terms of this agreement.


Presentation Transcript

1 ATH TRAND students who achieved proficie
ATH TRAND students who achieved proficiency in eight math strands on the 10th-grade WASL varied considerably between 1999 and 2006. 21.5 percent from one year to the next, which raises concerns about the reliability of strand results over time. In addition, math strands with the best and worst proficiency rates change from year to year. For In 1999, Content 3 (geometric sense) had the lowest percentage of students who achieved proficiency and Process 3 (making connections) the highest. In 2006, performance was lowest for Content 1 (number sense) and highest for Content 2 Student performance in Content 4 (probability and statistics) exemplifies the inconsistency of math strand results over time. Content 4 had the lowest proficiency rate in 2001 and 2004 but the highest proficiency rate in 2002 and Exhibit 2 Variation in the Percentage of Students Achieving Proficiency in Math Strands on the 10th-Grade WASL 19992000200120022003200420052006 Content 1 Content 2 Content 3 Content 4 Content 5 Process 1 Process 2 Process 3 Content 1 Number Sense Content 2 Measurement Content 3 Geometric Sense Content 4 Probability and Statistics Content 5 Algebraic Sense Process 1 Solve Problems/Reason Logically Process 2 Communicate Understanding Process 3 Making Connections EADING TRAND As with math strands, student performance in reading strands exhibits a substantial degree of percentage of students who were proficient in six reading strands on the 10th-grade WASL between 1999 and 2006. The percentage of students who were proficient in each reading strand varies by as much as 21.2 percent from year to year. Reading strands with the highest and lowest proficiency rates also vary In 1999, Strand 1 (literary comprehension) had the lowest percentage of students who analysis) the highest. In 2006, performance was lowest for Strand 1 (literary comprehension) and highest for Strand 3 (literary critical thinking). Student performance in one reading strand, Strand 1 (literary comprehension), epitomizes the irregularity of strand results over time. Strand 1 had the lowest proficiency rate in 1999, 2001, 2002, 2004, and 2006 but the highest rate in 2000 and Exhibit 3 Variation in the Percentage of Students Achieving Proficiency in Strands on the 10th-Grade WASL 19992000200120022

2 003200420052006 Strand 1 Strand 2 Strand
003200420052006 Strand 1 Strand 2 Strand 3 Strand 4 Strand 5 Strand 6 Strand 1 Literary Comprehension Strand 2 Literary Analysis Strand 3 Literary Critical Thinking Strand 4 Informational Comprehension Strand 5 Informational Analysis Strand 6 Informational Critical Thinking Because the trends illustrated in Exhibits 2 and 3 are not readily discernable, Appendices A and B report the percentage of students who achieved proficiency in math and reading strands on the 10th-grade WASL between 1999 and 2006 as well as annual changes in the proficiency rate for each TRAND displays the percentage of students who achieved proficiency in the writing strands: Strand 1 Content, Organization, and Style Strand 2 Writing Mechanics With writing, unlike the reading and math results, longitudinal trends are clearly apparent. In 2000, approximately 30 percent of students were proficient climbed to nearly 80 percent of students achieving proficiency. Performance trends in Strand 2 were improvement: in 2000, 60 percent of students were proficient, compared with slightly more than 80 percent six years later. The percentage of students who achieve proficiency in reading and math strands varies considerably over time. Strand-levelfrom year to year, which is based on a relatively small subset of test items, is less reliable than yearly performance on the reading and math assessments Variability in strand performance means that schools cannot use these results to diagnose specific content areas in need of improvement, but it does not diminish the overall reliability of the reading and math assessments. Strand results in writing are not characterized by the same degree of variation. Writing strands may be less affected by yearly variation in questions because the writing assessment consists of two writing "prompts" or tasks, which are scored differently than multiple-choice or http://www.k12.wa.us/CurriculumInstruct/writing/Annotations/ 2006/Grade10/Grade10AnnotationsIntro.pdf. Exhibit 4 Percentage of Students Who Achieved Proficiency in Strands on the 10th-Grade WASL 2000200120022003200420052006 Strand 1 Content, Organization, Style Strand 2 Writing Mechanics Reading and mathematics assessments, on the other hand, include a combi

3 nation of multiple-choice, short-answer,
nation of multiple-choice, short-answer, and extended-response questions. Questions are sampled so that “a particular question format…is not always associated with the same EALRs” and, hence, with the same strands. If the format of questions associated with a particular strand changes from year to year, and if students perform better in one format than in others, then strand results will also In a companion report, the Institute explores the distinction between open-ended responses and multiple-choice questions in greater detail. Ibid. ERFORMANCE ON ATH TRANDS FOR THE RADE Percentage Achieving Proficiency in Math Strands Strand 1999 2000 2001 2002 2003 2004 2005 2006 Content 1 30.4 41.9 39.1 45.3 48.3 43.0 54.0 36.3 Content 2 38.4 37.6 38.1 36.9 48.1 42.9 46.2 59.7 Content 3 30.1 42.8 44.2 37.7 37.9 39.7 44.7 53.5 Content 4 40.5 40.3 35.9 47.1 41.0 38.4 56.9 46.0 Content 5 37.5 49.7 40.1 41.6 49.9 45.2 49.4 42.3 Process 1 37.7 37.4 42.9 41.1 38.7 47.9 55.9 54.6 Process 2 35.6 45.0 52.3 46.9 44.4 49.8 56.6 57.1 Process 3 44.2 37.5 43.3 42.8 38.1 41.5 35.9 57.4 Annual Changes in Math Strand Proficiency Rates Strand 2000 2001 2002 2003 2004 2005 2006 Content 1 11.5 -2.8 6.2 3.0 -5.3 11.0 -17.7 Content 2 -0.8 0.5 -1.2 11.2 -5.2 3.3 13.5 Content 3 12.7 1.4 -6.5 0.2 1.8 5.0 8.8 Content 4 -0.2 -4.4 11.2 -6.1 -2.6 18.5 -10.9 Content 5 12.2 -9.6 1.5 8.3 -4.7 4.2 -7.1 Process 1 -0.3 5.5 -1.8 -2.4 9.2 8.0 -1.3 Process 2 9.4 7.3 -5.4 -2.5 5.4 6.8 0.5 Process 3 -6.7 5.8 -0.5 -4.7 3.4 -5.6 21.5 ERFORMANCE ON EADING TRANDS FOR THE RADE Percentage Achieving Proficiency in Reading Strands Strand 1999 2000 2001 2002 2003 2004 2005 2006 Strand 1 50.1 65.7 57.8 52.6 67.4 54.8 76.0 78.2 Strand 2 67.4 63.5 70.7 73.0 59.6 57.7 75.8 83.8 Strand 3 59.7 59.7 71.2 55.6 71.3 65.9 72.9 87.2 Strand 4 62.5 52.6 68.0 58.8 59.3 62.8 75.4 81.0 Strand 5 54.6 60.9 62.8 60.4 62.4 69.7 61.3 80.4 Strand 6 53.7 54.4 65.2 60.3 54.5 66.8 72.0 84.7 Annual Changes in Reading Strand Proficiency Rates Strand 2000 2001 2002 2003 2004 2005 2006 Strand 1 15.6 -7.9 -5.2 14.8 -12.6 21.2 2.2 Strand 2 -3.9 7.2 2.3 -13.4 -1.9 18.1 8.0 Strand 3 0.0 11.5 -15.6 15.7 -5.4 7.0 14.3 Strand 4 -9.9 1

4 5.4 -9.2 0.5 3.5 12.6 5.6 Strand 5 6.3
5.4 -9.2 0.5 3.5 12.6 5.6 Strand 5 6.3 1.9 -2.4 2.0 7.3 -8.4 19.1 Strand 6 0.7 10.8 -4.9 -5.8 12.3 5.2 12.7 For further information, please contact: Wade Cole at wcole@wsipp.wa.gov (360) 586-2791, or Robert Barnoski at barney@wsipp.wa.gov (360) 586-2740 Document No. 06-11-2205Washington State Public Policy The Washington State Legislature created the Washington State Institute for Public Policy in 1983. A Board of Directors—representing the legislature, the governor, and public universities—governs the Institute and guides the development of all activities. The Institute’s mission is to carry out practical research, at legislative direction, on i 110 Fifth Avenue Southeast, Suite 214 PO Box 40999 Olympia, WA 98504-0999 (360) 586-2677 www.wsipp.wa.gov November 2006TUDENT ARIES The 2006 Legislature direct Strand Corresponding EALR(s) Number sense 1.1 Measurement 1.2 Geometric sense 1.3 Probability and statistics 1.4 Algebraic sense 1.5 Solve problems/Reason logically 2.1, 2.2, 3. Communicate understanding 4.1, 4.2 Make connections 5.1, 5.2, 5.3 Initially, this report sought to determine whether poor performance in one or more strands may have SSB 6618, Chapter 352, Laws of 2006. http://www.k12.wa.us/assessment/wasl/MathPracticeTests/ AppendixB-HSmath.pdf. http://www.k12.wa.us/assessment/WASL/overview.aspx. Thus, yearly variation in Students are proficient in a strand when their scores are equal to or higher than the estimated strand score for students who met standard in the subject-area assessment. Catherine S. Taylor. Washington Assessment of Student Learning, Grade 10, 2002, Technical Report. UMMARYThis report examines longitudinal variability in student performance on reading, writing, and math strands for the 10th-grade Washington Assessment of Student Learning (WASL). The percentage of students who are proficient in reading and math strands varies considerably over Strand-level performance from year to year, which is based on a relatively smaless reliable than performance on the reading and math assessments overallVariability in strand results does not diminish the overall reliability of the reading and math assessments. Strand results in writing are not characterized by the same degree of variation as reading and math.