PPT-Data Analysis 53
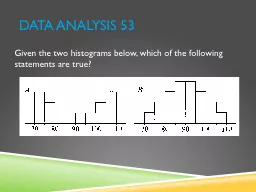
Given the two histograms below which of the following statements are true I The Empirical Rule applies only to set A II You can be sure that the standard deviation
Download Presentation
"Data Analysis 53" is the property of its rightful owner. Permission is granted to download and print materials on this website for personal, non-commercial use only, provided you retain all copyright notices. By downloading content from our website, you accept the terms of this agreement.
Presentation Transcript
Transcript not available.