/
Long-Term Care Providers and Services Users in the United S Long-Term Care Providers and Services Users in the United S

Long-Term Care Providers and Services Users in the United S - PowerPoint Presentation

liane-varnes
liane-varnes . @liane-varnes
Follow
413 views
Uploaded On 2016-10-17

Long-Term Care Providers and Services Users in the United S - PPT Presentation

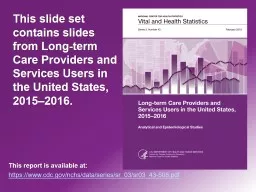
This report is available at httpwwwcdcgovnchsdataseriessr03sr03038pdf This slide set contains slides from LongTerm Care Providers and Services Users in the United States Data From the National Study of LongTerm Care Providers ID: 477092

services care long term care services term long providers 2014 united states data number sector percentages appendix users health

Share:

Link:

Embed:

Download Presentation from below link

Download Presentation The PPT/PDF document "Long-Term Care Providers and Services Us..." is the property of its rightful owner. Permission is granted to download and print the materials on this web site for personal, non-commercial use only, and to display it on your personal computer provided you do not modify the materials and that you retain all copyright notices contained in the materials. By downloading content from our website, you accept the terms of this agreement.


Presentation Transcript

Slide1

Long-Term Care Providers and Services Users in the United States: Data From the National Study of Long-Term Care Providers, 2013–2014

This report is available at:http://www.cdc.gov/nchs/data/series/sr_03/sr03_038.pdf

This slide set contains

slides from Long-Term

Care Providers and Services Users in the United States: Data From the National Study of Long-Term Care Providers,

2013–2014.Slide2
Percent distribution of long-term care services providers,

by sector and region: United States, 2014NOTE: Percentages are based on the unrounded numbers. SOURCES:

CDC/NCHS, Long-Term Care Providers and Services Users in the United States: Data From the National Study of Long-Term Care Providers, 2013–2014, Figure 1 and Table 1 in Appendix B.Slide3
Percent distribution of long-term care services providers, by sector and metropolitan statistical area

status: United States, 2014

NOTES: Percentages may not add to 100 because of rounding. Percentages are based on the unrounded numbers. Metropolitan statistical areas and micropolitan statistical areas are geographic entities delineated by the Office of Management and Budget for use by federal statistical agencies in collecting, tabulating, and publishing federal statistics. A metropolitan statistical area contains a core urban area of 50,000 or more population, and a micropolitan statistical area contains an urban core of at least 10,000 (but less than 50,000) population. Each metropolitan or micropolitan statistical area consists of one or more counties and includes the counties containing the core urban area, as well as any adjacent counties that have a high degree of social and economic integration (as measured by commuting to work) with the urban core (Office of Management and Budget, 2009).SOURCES: CDC/NCHS, Long-Term Care Providers and Services Users in the United States: Data From the National Study of Long-Term Care Providers, 2013–2014, Figure 2 and Table 1 in Appendix B.Slide4
Long-term care services provider capacity per 1,000 people

aged 65 and over, by sector and region: United States, 2014

NOTES: Capacity refers to the number of certified nursing home beds, the number of licensed residential care community beds, and the maximum number of adult day services center participants allowed. See Appendix A for more information on definitions used for each provider type. Capacity for home health agencies and hospices was not examined because licensed maximum capacity or a similar metric was not available.SOURCE: CDC/NCHS, Long-Term Care Providers and Services Users in the United States: Data From the National Study of Long-Term Care Providers, 2013–2014, and Figure 3.Slide5
Percent distribution of long-term care

services providers, by sector and ownership: United States, 2014

NOTES: See Appendix A for definitions of ownership used for each sector. Percentages may not add to 100 because of rounding. Percentages are based on the unrounded numbers.SOURCE: CDC/NCHS, Long-Term Care Providers and Services Users in the United States: Data From the National Study of Long-Term Care Providers, 2013–2014, Figure 4 and Table 1 in Appendix B.Slide6
Percentage of long-term care services providers that are

chain-affiliated, by sector: United States, 2014

NOTES: See Appendix A for more information on the definition of chain as used for each sector. Chain affiliation for home health agencies and hospices was not examined because this information was not available.SOURCES: CDC/NCHS, Long-Term Care Providers and Services Users in the United States: Data From the National Study of Long-Term Care Providers, 2013–2014 , Figure 5 and Table 1 in Appendix B.Slide7
Percentage of long-term care services providers that are

Medicare- and Medicaid-certified, by sector: United States, 2014

NOTES: Medicare certification is not applicable for adult day services centers and residential care communities. See Appendix A for definitions of certifications used for each sector. SOURCES: CDC/NCHS, Long-Term Care Providers and Services Users in the United States: Data From the National Study of Long-Term Care Providers, 2013–2014 , Figure 6 and Table 1 in Appendix B.Slide8
Percent distribution of long-term care services providers, by

sector and number of people served daily: United States, 2014

NOTES: Number of people served categorizes the number of current residents (nursing homes, residential care communities) or the average daily attendance of participants in a typical week (adult day services centers) into three categories: 1–25, 26–100, and more than 100. See Appendix A for more information on how number of people served was defined for each sector. Percentages may not add to 100 because of rounding. Percentages are based on the unrounded numbers. This figure does not include home health agencies or hospices because the data on services users in these sectors that were used for this report are about patients served annually, not daily. Daily use among home health agencies and hospices could not be derived from these data.SOURCES: CDC/NCHS, Long-Term Care Providers and Services Users in the United States: Data From the National Study of Long-Term Care Providers, 2013–2014, Figure 7 and Table 1 in Appendix B.Slide9
Percent distribution of long-term care services providers, by

sector and number of people served annually: United States, 2013

NOTES: Number of people served is derived from the number of home health patients whose episode of care ended at any time in 2013 and the number of hospice patients receiving care at any time in 2013, respectively, and has three categories: 1–100, 101–300, and more than 300. See Appendix A for more information on how number of people served was defined for each sector. Percentages may not add to 100 because of rounding. Percentages are based on the unrounded numbers. This figure does not include adult day services centers, nursing homes, or residential care communities because the data on services users in these sectors that were used for this report are about services users served daily, not annually. Annual use among adult day services centers, nursing homes, or residential care communities could not be derived from these data.SOURCES: CDC/NCHS, Long-Term Care Providers and Services Users in the United States: Data From the National Study of Long-Term Care Providers, 2013–2014, Figure 8 and Table 1 in Appendix B.Slide10

NOTES: FTEs are full-time equivalents. Only employees are included for all staff types; contract staff are not included. For adult day services centers and residential care communities, aides refer to certified nursing assistants, home health aides, home care aides, personal care aides, personal care assistants, and medication technicians or medication aides. For home health agencies and hospices, aides refer to home health aides. For nursing homes, aides refer to certified nurse aides, medication aides, and medication technicians. See Technical Notes for information on how outliers were identified and coded. Percentages may not add to 100 because of rounding. Percentages are based on the unrounded numbers.

SOURCES: CDC/NCHS, Long-Term Care Providers and Services Users in the United States: Data From the National Study of Long-Term Care Providers, 2013–2014, Figure 9 and Table 2 in Appendix B.Percent distribution and total number of nursing and social work employee full-time equivalents, by sector and staff type: United States, 2014Slide11
Percentage of long-term care services providers with any

full-time equivalent employees, by sector and staff type: United States, 2014

NOTES: Only employees are included for all staff types; contract staff are not included. For adult day services centers and residential care communities, aides refer to certified nursing assistants, home health aides, home care aides, personal care aides, personal care assistants, and medication technicians or medication aides. For home health agencies and hospices, aides refer to home health aides. For nursing homes, aides refer to certified nurse aides, medication aides, and medication technicians. Social workers include licensed social workers or persons with a bachelor’s or master’s degree in social work in adult day services centers and residential care communities; medical social workers in home health agencies and hospices; and qualified social workers in nursing homes. Data for activities director and staff are not available for home health agencies and hospices. See Technical Notes for information on how outliers were identified and coded. Percentages are based on the unrounded numbers.SOURCES: CDC/NCHS Long-Term Care Providers and Services Users in the United States: Data From the National Study of Long-Term Care Providers, 2013–2014, Figure 10 and Table 2 in Appendix B.Slide12
Average hours per resident or participant

per day, by sector and staff type: United States, 2014

NOTES: Only employees are included for all staff types; contract staff are not included. For adult day services centers and residential care communities, aides refer to certified nursing assistants, home health aides, home care aides, personal care aides, personal care assistants, and medication technicians or medication aides. For home health agencies and hospices, aides refer to home health aides. For nursing homes, aides refer to certified nurse aides, medication aides, and medication technicians. Social workers include licensed social workers or persons with a bachelor’s or master’s degree in social work in adult day services centers and residential care communities; medical social workers in home health agencies and hospices; and qualified social workers in nursing homes. For adult day services centers, average hours per participant per day was computed by multiplying the number of full-time equivalent (FTE) employees for the staff type by 35 hours, divided by the average daily attendance of participants and by 5 days. For nursing homes and residential care communities, average hours per resident per day was computed by multiplying the number of FTE employees for the staff type by 35 hours, divided by the number of current residents and by 7 days. See Technical Notes for information on how outliers were identified and coded. Hours per patient per day could not be provided for home health agencies or hospices, because the administrative data available provided total number of all patients served in a year, not the number served on a given day, which is needed to produce this estimate.SOURCES: CDC/NCHS, Long-Term Care Providers and Services Users in the United States: Data From the National Study of Long-Term Care Providers, 2013–2014, Figure 11 and Table 2 in Appendix B.Slide13
Percentage of long-term care services providers that

provide social work services, by sector: United States, 2014NOTES: Social work services refer to services provided by licensed social workers or persons with a bachelor’s or master’s degree in social work, and include an array of services such as psychosocial assessment, individual or group counseling, and referral services. See Appendix A for more information on how the provision of social work services was defined for each sector. See Chapter 4 for an explanation of differences in how services were measured in 2012 and 2014. Percentages are based on the unrounded numbers.

SOURCES: CDC/NCHS, Long-Term Care Providers and Services Users in the United States: Data From the National Study of Long-Term Care Providers, 2013–2014, Figure 12 and Table 3 in Appendix B.Slide14
Percentage of long-term care services providers that provide mental health or counseling services, by sector: United States, 2014

NOTES: Mental health services refer to services that target residents' mental, emotional, psychological, or psychiatric well-being and include diagnosing, describing, evaluating, and treating mental conditions. See Appendix A for more information on how the provision of mental health services was defined for each sector. See Chapter 4 for an explanation of differences in how services were measured in 2012 and 2014. The available administrative data did not have information on whether or not home health agencies provided mental health or counseling services. Percentages are based on the unrounded numbers

SOURCES: CDC/NCHS, Long-Term Care Providers and Services Users in the United States: Data From the National Study of Long-Term Care Providers, 2013–2014, Figure 13 and Table 3 in Appendix B.Slide15
Percentage of long-term care services providers that provide

any therapeutic services, by sector: United States, 2014

NOTES: Any therapeutic services refer to physical, occupational, or speech therapy services. See Appendix A for more information on how the provision of any therapeutic services was defined for each sector. See Chapter 4 for an explanation of differences in how services were measured in 2012 and 2014. Percentages are based on the unrounded numbers.SOURCES: CDC/NCHS, Long-Term Care Providers and Services Users in the United States: Data From the National Study of Long-Term Care Providers, 2013–2014, Figure 14 and Table 3 in Appendix B.Slide16
Percentage of long-term care services providers that provide skilled nursing or nursing services, by sector: United States, 2014

NOTES: Skilled nursing services refer to services that must be performed by a registered nurse or licensed practical nurse and are medical in nature. See Appendix A for more information on how the provision of skilled nursing services was defined for each sector. See Chapter 4 for an explanation of differences in how services were measured in 2012 and 2014. Percentages are based on the unrounded numbers.

SOURCES: CDC/NCHS, Long-Term Care Providers and Services Users in the United States: Data From the National Study of Long-Term Care Providers, 2013–2014, Figure 15 and Table 3 in Appendix B.Slide17
Percentage of long-term care services providers that provide pharmacy or pharmacist services, by sector: United States, 2014

NOTES: Pharmacy services refer to the filling of and delivery of prescriptions. See Appendix A for more information on how the provision of pharmacy services was defined for each sector. See Chapter 4 for an explanation of differences in how services were measured in 2012 and 2014. The available administrative data did not have information on whether or not nursing homes provided pharmacy or pharmacist services. Percentages are based on the unrounded numbers.

SOURCES: CDC/NCHS, Long-Term Care Providers and Services Users in the United States: Data From the National Study of Long-Term Care Providers, 2013–2014, Figure 16 and Table 3 in Appendix B.Slide18
Percentage of long-term care services providers that

provide hospice services, by sector: United States, 2014NOTES: See Appendix A for more information on how the provision of hospice services was defined for each sector. See Chapter 4 for an explanation of differences in how services were measured in 2012 and 2014. Percentages are based on the unrounded numbers. All hospices were expected to provide hospice services.

SOURCES: CDC/NCHS, Long-Term Care Providers and Services Users in the United States: Data From the National Study of Long-Term Care Providers, 2013–2014, Figure 17 and Table 3 in Appendix B.Slide19
Percentage of long-term care services providers that

provide dental services, by sector: United States, 2014

NOTES: See Appendix A for more information on how the provision of dental services was defined for each sector. Percentages are based on the unrounded numbers. The available administrative data did not have information on whether or not home health agencies or hospices provided dental services. SOURCES: CDC/NCHS, Long-Term Care Providers and Services Users in the United States: Data From the National Study of Long-Term Care Providers, 2013–2014, Figure 18 and Table 3 in Appendix B.Slide20
Percentage of long-term care services providers that

provide podiatry services, by sector: United States, 2014

NOTES: See Appendix A for more information on how the provision of podiatry services was defined for each sector. Percentages are based on the unrounded numbers. The available administrative data did not have information on whether or not home health agencies or hospices provided podiatry services. SOURCES: CDC/NCHS, Long-Term Care Providers and Services Users in the United States: Data From the National Study of Long-Term Care Providers, 2013–2014, Figure 19 and Table 3 in Appendix B.Slide21
Percent distribution of long-term care services providers,

by sector and dementia care unit: United States, 2014

NOTES: See Appendix A for more information on how dementia care units were defined for each sector. Percentages may not add to 100 because of rounding. Percentages are based on the unrounded numbers. Dementia care units or dementia-only providers were not examined for adult day services centers, home health agencies, or hospices because these topics are more relevant for residential sectors such as nursing homes and residential care communities.SOURCES: CDC/NCHS, Long-Term Care Providers and Services Users in the United States: Data From the National Study of Long-Term Care Providers, 2013–2014, Figure 20 and Table 3 in Appendix B.Slide22
Percentage of long-term care services providers that

screen for depression, by sector: United States, 2014NOTES: Depression screening refers to screening for depression with a standardized tool or accepting results from depression screening performed by other health care providers. See Appendix A for more information on how depression screening was defined for each sector. Percentages are based on the unrounded numbers. Depression screening was not examined among hospices and nursing homes because this information was not available.

SOURCES: CDC/NCHS, Long-Term Care Providers and Services Users in the United States: Data From the National Study of Long-Term Care Providers, 2013–2014, Figure 21 and Table 3 in Appendix B.Slide23
Percent distribution of long-term care services users,

by sector and age group: United States, 2013 and 2014

NOTES: Denominators used to calculate percentages for adult day services centers, nursing homes, and residential care communities were the number of current participants enrolled in adult day services centers, the number of current residents in nursing homes, and the number of current residents in residential care communities in 2014, respectively. Denominators used to calculate percentages for home health agencies and hospices were the number of patients who received care from Medicare-certified home health agencies at any time in 2013 and the number of patients who received care from Medicare-certified hospices at any time in 2013, respectively. See Technical Notes for more information on the data sources used for each sector. Percentages may not add to 100 because of rounding. Percentages are based on the unrounded numbers.SOURCES: CDC/NCHS, Long-Term Care Providers and Services Users in the United States: Data From the National Study of Long-Term Care Providers, 2013–2014, Figure 22 and Table 4 in Appendix B.Slide24
Percent distribution of long-term care services users,

by sector and sex: United States, 2013 and 2014

NOTES: Denominators used to calculate percentages for adult day services centers, nursing homes, and residential care communities were the number of current participants enrolled in adult day services centers, the number of current residents in nursing homes, and the number of current residents in residential care communities in 2014, respectively. Denominators used to calculate percentages for home health agencies and hospices were the number of patients whose episode of care ended at any time in 2013 and the number of patients who received care from Medicare-certified hospices at any time in 2013, respectively. See Technical Notes for more information on the data sources used for each provider type. Percentages may not add to 100 because of rounding. Percentages are based on the unrounded numbers.SOURCES: CDC/NCHS, Long-Term Care Providers and Services Users in the United States: Data From the National Study of Long-Term Care Providers, 2013–2014, Figure 23 and Table 4 in Appendix B.Slide25
Percent distribution of long-term care services users, by sector

and race and Hispanic origin: United States, 2013 and 2014

1Includes non-Hispanic American Indian or Alaska Native, non-Hispanic Asian, non-Hispanic Native Hawaiian or other Pacific Islander, non-Hispanic of two or more races, and unknown race and ethnicity.NOTES: Denominators used to calculate percentages for adult day services centers, nursing homes, and residential care communities were the number of current participants enrolled in adult day services centers, the number of current residents in nursing homes, and the number of current residents in residential care communities in 2014, respectively. Denominators used to calculate percentages for home health agencies and hospices were the number of patients who received care from Medicare-certified home health agencies at any time in 2013 and the number of patients who received care from Medicare-certified hospices at any time in 2013, respectively. See Technical Notes for more information on the data sources used for each provider type. Percentages may not add to 100 because of rounding. Percentages are based on the unrounded numbers.SOURCES: CDC/NCHS, Long-Term Care Providers and Services Users in the United States: Data From the National Study of Long-Term Care Providers, 2013–2014, Figure 24 and Table 4 in Appendix B; and U.S. Census Bureau, Population Division, Population Estimates, July 1, 2014.Slide26
Percentage of long-term care services users with Medicaid as

payer source, by sector: United States, 2013 and 2014NOTES: Denominators used to calculate percentages for adult day services centers, nursing homes, and residential care communities were the number of current participants enrolled in adult day services centers, the number of current residents in nursing homes, and the number of current residents in residential care communities in 2014, respectively. The denominator used to calculate percentages for home health agencies was the number of patients whose episode of care ended at any time in 2013. Data on Medicaid as payer source were not available for hospice patients. See Appendix A for more information on how Medicaid as payer source was defined for each sector.

SOURCES: CDC/NCHS, Long-Term Care Providers and Services Users in the United States: Data From the National Study of Long-Term Care Providers, 2013–2014, Figure 25 and Table 4 in Appendix B.Slide27
Percentage of long-term care services users with a diagnosis

of Alzheimer's disease or other dementias, depression, and diabetes, by sector: United States, 2013 and 2014

NOTES: Denominators used to calculate percentages for adult day services centers, nursing homes, and residential care communities were the number of current participants enrolled in adult day services centers, the number of current residents in nursing homes, and the number of current residents in residential care communities in 2014, respectively. Denominators used to calculate percentages for home health agencies and hospices were the number of patients who received care from Medicare-certified home health agencies at any time in 2013 and the number of patients who received care from Medicare-certified hospices at any time in 2013, respectively. See Technical Notes for more information on the data sources used for each sector. Percentages are based on the unrounded numbers.SOURCES: CDC/NCHS, Long-Term Care Providers and Services Users in the United States: Data From the National Study of Long-Term Care Providers, 2013–2014, Figure 26 and Table 4 in Appendix B.Slide28
Percentage of long-term care services users needing any

assistance with activities of daily living, by sector and activity: United States, 2013 and 2014

NOTES: Denominators used to calculate percentages for adult day services centers, nursing homes, and residential care communities were the number of current participants enrolled in adult day services centers, the number of current residents in nursing homes, and the number of current residents in residential care communities in 2014, respectively. The denominator used to calculate percentages for home health agencies was the number of patients whose episode of care ended at any time in 2013. Participants, patients, or residents were considered needing any assistance with a given activity if they needed help or supervision from another person or used special equipment to perform the activity. Data on need for assistance with activities of daily living were not available for hospice patients. See Appendix A for more information on how needing any assistance with a given activity was defined. Percentages are based on the unrounded numbers.SOURCES: CDC/NCHS, Long-Term Care Providers and Services Users in the United States: Data From the National Study of Long-Term Care Providers, Figure 27 and Table 4 in Appendix B.Slide29
Percentage of long-term care services users with overnight

hospital stays, emergency department visits, and falls, by sector: United States, 2013 and 2014

NOTES: Denominators used to calculate percentages for adult day services centers, nursing homes, and residential care communities were the number of current participants enrolled in adult day services centers, the number of current residents in nursing homes, and the number of current residents in residential care communities in 2014, respectively. The denominator used to calculate percentages for home health agencies was the number of patients whose episode of care ended at any time in 2013. For adult day services centers and residential care communities, adverse events refer to a period of 90 days prior to the survey. For home health agencies, adverse events refer to a period since the last Outcome and Assessment Information Set assessment. For nursing homes, falls refer to the period since admission or since the prior assessment, whichever is more recent. For home health agencies, data were not available for falls. For nursing homes, data were not available for emergency department visits, and hospitalizations were not included in this report because the timing of Medicare claims data did not match the other nursing home data sets used here. For hospice patients, data were not available for any adverse event. See Technical Notes for more information on the data sources used for each sector. Percentages are based on the unrounded numbers.SOURCES: CDC/NCHS, Long-Term Care Providers and Services Users in the United States: Data From the National Study of Long-Term Care Providers, Figure 28 and Table 4 in Appendix B.Slide30

For questions about this

report or NSLTCP, please contact the Long-Term Care Statistics Branch at NCHS.Email: ltcsbfeedback@cdc.govPhone: 301-458-4747Visit us on the web at: http://www.cdc.gov/nchs/nsltcp.htm NSLTCP