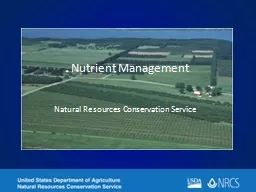
/
Nutrient Management Natural Resources Conservation Service Nutrient Management Natural Resources Conservation Service

Nutrient Management Natural Resources Conservation Service - PowerPoint Presentation

liane-varnes
liane-varnes . @liane-varnes
Follow
349 views
Uploaded On 2018-10-25

Nutrient Management Natural Resources Conservation Service - PPT Presentation

National Nutrient Management Guidance Better Nutrient Management Guidance 3 Important Documents Nutrient Management Standard CPS590 Nutrient Management Policy GM190402 Nutrient Management Policy Implementation NI190302 ID: 696347

management nutrient risk index nutrient management index risk soil criteria practice standard leaching application national nitrogen phosphorus assessment manure

Share:

Link:

Embed:

Download Presentation from below link

Download Presentation The PPT/PDF document "Nutrient Management Natural Resources Co..." is the property of its rightful owner. Permission is granted to download and print the materials on this web site for personal, non-commercial use only, and to display it on your personal computer provided you do not modify the materials and that you retain all copyright notices contained in the materials. By downloading content from our website, you accept the terms of this agreement.


Presentation Transcript

Slide1

Nutrient Management

Natural Resources Conservation ServiceSlide2

National Nutrient Management Guidance

Better Nutrient Management Guidance

3 Important Documents

Nutrient Management Standard (CPS-590)

Nutrient

Management Policy (GM-190-402)

Nutrient Management Policy Implementation (NI-190-302)Slide3

National

Nutrient Management Practice Standard

DEFINITION

Managing the amount (rate), source, placement (method of application), and timing of plant nutrients and soil amendments.

4 R’s of Nutrient Stewardship

Right Rate

Right Source

Right Placement

Right Time

Minor RewordingSlide4

PURPOSE

- To budget, supply, and conserve nutrients for plant production.

- To minimize agricultural nonpoint source pollution of surface and groundwater resources.- To properly utilize manure or organic by-products as a plant nutrient source.

-

To protect air quality by reducing odors, nitrogen emissions (ammonia, oxides of nitrogen), and the formation of atmospheric particulates.

- To maintain or improve the physical, chemical, and biological condition of soil.

National

Nutrient Management Practice StandardSlide5

CONDITIONS WHERE PRACTICE APPLIES

- This practice applies to all lands where plant nutrients and soil amendments are applied.

This standard does not apply to one-time nutrient applications to establish perennial crops.

National

Nutrient Management Practice Standard

Minor RewordingSlide6

Criteria

- The NRCS-approved nutrient risk assessment for

nitrogen must be completed on all sites unless the State NRCS, with the concurrence of State water quality control authorities, has determined specific conditions where nitrogen leaching is not a risk to water quality.

National

Nutrient Management Practice Standard

Nitrogen Leaching IndexSlide7

302.2 Technical Criteria for Risk Assessment

B.

Nitrogen Risk Assessment Criteria.

Leaching Index.—The current NRCS-approved tool to assess the nitrogen leaching potential is the Leaching Index (LI).

If N leaching is a concern, planners will use the N risk assessment and implement needed BMP (N application at planting, Split application …)

National

Instructions

Part

302 –Nutrient Management Implementation

Nitrogen Leaching IndexSlide8

Average Annual Percolation

Considers

evapotranspiration

of the crop

Inputs average monthly precipitation and the hydrologic soil group

Tables will be developed by county and soil group.

Nitrogen Leaching Index

RUSLE 2

Nitrogen Leaching IndexSlide9

National

Nutrient Management Practice Standard

Criteria

The NRCS-approved nutrient risk assessment for

phosphorus

must be completed when:

phosphorus application rate exceeds land-grant university fertility rate guidelines for the planned crop(s) The planned area is within a phosphorus- impaired watershed-The NRCS and State water quality control authority have not determined specific conditions where the risk of phosphorus loss is low.

Phosphorus IndexSlide10

National

Nutrient Management Practice Standard

Criteria

Nutrient planning must be based on current soil and manure testing

-in accordance with land-grant university guidance

or

-industry practice, if recognized by the university

Soil &

Manure/Litter TestingSlide11

National

Nutrient Management Practice Standard

Criteria

Manure analyses must include, at minimum, total nitrogen (N), ammonium N, total phosphorus (P) or P

2

O

5

, total potassium (K) or K2O, and percent solids, or -follow land-grant university guidance regarding required analyses

Manure/Litter TestingSlide12

Current AL

Nutrient Management Practice Standard

Criteria

-Laboratory results will need to be adjusted for nitrogen application losses by using Tables 2 and 3.

M

anure

/Litter

TestingSlide13

Current AL

Nutrient Management Practice Standard

Table 2Slide14

Current AL

Nutrient Management Practice Standard

Table 3Slide15

National

Nutrient Management Practice Standard

Criteria

The following nutrient use efficiency strategies or technologies must be considered:

• slow and controlled release fertilizers

• nitrification and urease inhibitors• enhanced efficiency fertilizers • incorporation or injection • timing and number of applications • soil nitrate and organic N testing

Additional Criteria to Minimize Nonpoint PollutionSlide16

National

Nutrient Management Practice Standard

Criteria

The following nutrient use efficiency strategies or technologies must be considered:

• Coordinate nutrient applications with optimum crop nutrient uptake

• Corn Stalk Nitrate Test (CSNT), Pre-Sidedress Nitrate Test (PSNT), and Pre-Plant Soil Nitrate Test (PPSN) • Tissue testing, chlorophyll meters, and spectral analysis technologies • Other land-grant university recommended technologies that improve nutrient use efficiency and minimize surface or groundwater resource concerns.

Additional Criteria to Minimize Nonpoint PollutionSlide17

National

Nutrient Management Practice Standard

Criteria

Nitrogen and phosphorus application rates must be planned based on risk assessment results as determined by NRCS-approved nitrogen and phosphorus risk assessment tools.

Additional Criteria to Properly Utilize ManureSlide18

302.2 Technical Criteria for Risk Assessment

D. Minimum Criteria for State P-Index Tools.

- Consider nutrient losses caused by water and wind erosion using current NRCS water and wind erosion prediction technology (RUSLE 2).

- At a minimum, consider STP; time, rate, and method of P application; erosion; runoff; and leaching (when leaching is applicable) factors in the assessment of P- loss risk from fields.

- Demonstrate that risk increases with increasing runoff, erosion, STP, application rate, and also depends on method of application.

National InstructionsPart

302 –Nutrient Management ImplementationP-IndexSlide19

302.2 Technical Criteria for Risk Assessment

D. Minimum Criteria for State P-Index Tools.

Include the following risk categories:

Low risk—phosphorus can be applied at rates greater than crop requirement not to exceed the nitrogen requirement for the succeeding crop

Moderate risk—phosphorus can be applied not to exceed the crop requirement rate or crop removal rateHigh risk— phosphorus can be applied not to exceed the crop removal rate if the following requirements are met:

-- A soil phosphorus drawdown strategy has been implemented-- A site assessment for nutrients and soil loss has been conducted to determine if mitigation practices are required to protect water quality.National

InstructionsPart 302 –Nutrient Management Implementation

P-IndexSlide20

302.2 Technical Criteria for Risk Assessment

F. Phosphorus Application.

If increases in soil phosphorus levels are expected (i.e., when N-based application rates are used), the nutrient management plan shall document:

(i) The soil P levels at which it is desirable to convert to P-based planning

(ii) The proposed plan for STP drawdown from the production and harvesting of crops

(iii) Management activities or techniques used to reduce the potential for P transport and lossNational Instructions

Part 302 –Nutrient Management Implementation

P-IndexSlide21

Alabama P-Index

STP

Rate

Method

Erosion

RunoffSlide22

Alabama P-Index

Low Risk

Moderate Risk

High Risk

New

vs

Old

3 Risk

C

ategories

vs

4 Field VulnerabilitySlide23

Alabama P-Index

Other Practices that May

Reduce Risk

Reduced

tillage systems and cover crops to reduced runoff

Implementation of intensive grazing systems to reduced runoff

Use of precision application equipment to increase the accuracy of applications

Application of other products with the litter that may reduced P loss risk Slide24

Reduced Tillage Systems to Reduced Runoff

Soils

Infiltration (in/hr)

Sulivan

et al 2007Slide25

National

Nutrient Management Practice Standard

Use no-till/strip till, cover crops and crop rotation

Use variable-rate application based on crop yield, site-specific variability, soil characteristics, soil test and other factors

Soil test should not be older than 1 year

Use soil test, plant tissue analyses and field observations to check for secondary plant nutrient deficiencies or toxicity

Use adaptive nutrient management learning process to improve nutrient use efficiency

ConsiderationsSlide26

302.2 Adaptive Nutrient Management

A process used to plan, implement, evaluate, and adjust nutrient application strategies over time (multiple seasons).

The process is intended to allow for continued adjustment of the CPS Code 590 4Rs plan to achieve better nutrient-use efficiency.

General Manual

Part

402 –Nutrient ManagementSlide27

302.2 Adaptive Nutrient Management

The process is to be carried out by producers themselves, in cooperation with the land-grant university, or with other agencies and industry partners following prescribed protocols developed by the State NRCS, land-grant university, or other appropriate technical agencies and industry.

The results of adaptive nutrient management testing that meet the established protocols and are concurred with by NRCS and the land-grant university may be used in nutrient planning where appropriate.

General Manual

Part

402 –Nutrient ManagementSlide28

Current AL

Nutrient Management Practice Standard

Other needed information

Averaged Nutrient Value of Manure/Litter (Table 1)

Available N Provided by Cover Crop (Table 4)

Recommended Application Distance for Manure/Litter (Table 9)

Filter Strips

Riparian Forest Buffer Field BoardersSlide29

Needed Feedback

- N Leaching IndexSlide30

Needed Feedback

- N Leaching Index

- P IndexSlide31

Needed Feedback

- N Leaching Index

- P Index

- Soil and Manure/Litter TestingSlide32

Needed Feedback

- N Leaching Index

- P Index

- Soil and Manure/Litter Testing

-

Nutrient Efficiency StrategiesSlide33

Needed Feedback

- N Leaching Index

- P Index

- Soil and Manure/Litter Testing

- Nutrient Efficiency Strategies

Considerations

Reduced Tillage and Cover Crops Adaptive Nutrient ManagementSlide34

Needed Feedback

- N Leaching Index

- P Index

- Soil and Manure/Litter Testing

- Nutrient Efficiency Strategies

- Considerations

- Other Information Averaged Nutrient Values N Provided by Cover Crops Filter StripsSlide35

QUESTIONS?