/
ROAD CRASH FACTSHEET ROAD CRASH FACTSHEET

ROAD CRASH FACTSHEET - PDF document

linda
linda . @linda
Follow
343 views
Uploaded On 2021-10-11

ROAD CRASH FACTSHEET - PPT Presentation

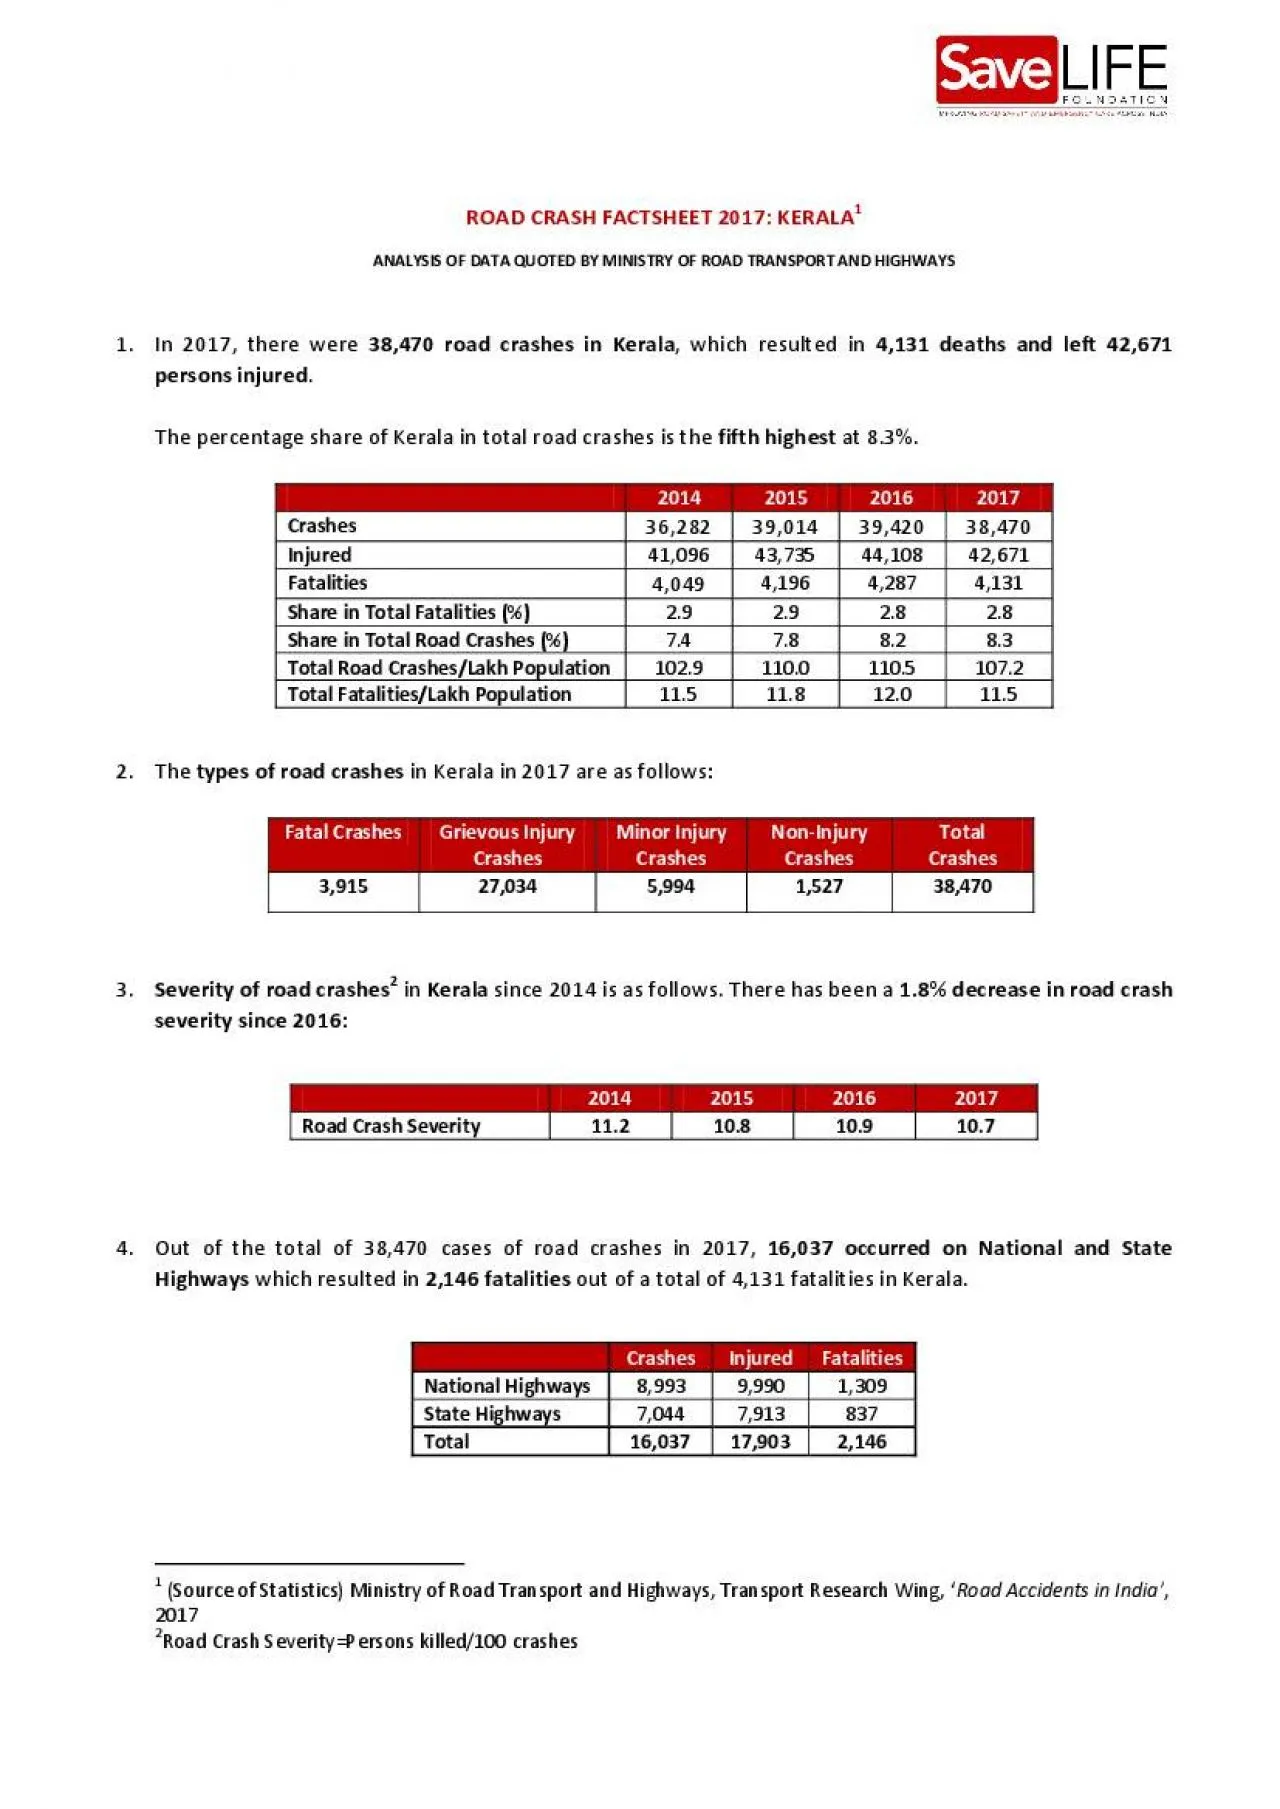
2017KERALA1ANALYSIS OF DATA QUOTED BY MINISTRY OF ROAD TRANSPORT AND HIGHWAYS1In 2017 there were 38470road crashes in Kerala which resulted in 4131deaths and left 42671persons injuredThe percentage sh ID: 900411

crashes road crash kerala road crashes kerala crash fatalities total injured persons deaths motor 2017 highest severity 201 due

Share:

Link:

Embed:

Download Presentation from below link

Download Pdf The PPT/PDF document "ROAD CRASH FACTSHEET" is the property of its rightful owner. Permission is granted to download and print the materials on this web site for personal, non-commercial use only, and to display it on your personal computer provided you do not modify the materials and that you retain all copyright notices contained in the materials. By downloading content from our website, you accept the terms of this agreement.


Presentation Transcript

1 ROAD CRASH FACTSHEET 201 7 : KERALA 1
ROAD CRASH FACTSHEET 201 7 : KERALA 1 ANALYSIS OF DATA QUO TED BY MINISTRY OF R OAD TRANSPORT AND HI GHWAYS 1. In 201 7 , there were 38,470 road crashes in Kerala , which resulted in 4 , 131 deaths and left 42,671 persons injured . The percentage share of Kerala in total road crashes is the fifth highest at 8.3 % . 2014 2015 2016 2017 Crashes 36,282 39,014 39,420 38,470 Injured 41,096 43,735 44,108 42,671 Fatalities 4,049 4,196 4,287 4,131 Share in Total Fatalities (%) 2.9 2.9 2.8 2.8 Share in Total Road Crashes (%) 7.4 7.8 8.2 8.3 Total Road Crashes/Lakh Population 102.9 110.0 110.5 107.2 Total Fatalities/Lakh Population 1 1. 5 1 1.8 1 2. 0 11.5 2. The type s of road crashe s in Kerala in 2017 are as follows: Fatal Crashes Grievous Injury Crashes Minor Injury Crashes Non - Injury Crashes Total Crashes 3,915 27,034 5,994 1,527 38,470 3. Severity of road crashes 2 in Kerala since 201 4 is as follows. There has been a 1.8 % decrease in road crash severity since 201 6 : 2014 2015 2016 2017 Road Crash Severity 11.2 10.8 1 0.9 10.7 4. Out of the total of 38,470 cases of road crashe s in 2017, 16,037 occurred on National and State Highways which resulted in 2,146 fatalities out of a total of 4,131 fatalities in Kerala . C ra s

2 h es Injured Fatalities National H
h es Injured Fatalities National Highways 8,993 9,990 1,309 State Highways 7,044 7,913 837 Total 16,037 17,903 2,146 1 (Source of Statistics) Ministry of Road Transport and Highways, Transport Research Wing, ‘ Road Accident s in India’ , 2017 2 Road Crash Severity=Persons killed/100 crashe s 5. Following is the information on road crash deaths caused due to potholes and steep grades in the State of Kerala : Type of Road Conditions Road Crashes Fatalities Persons Injured Potholes 522 52 779 S teep Grades 2,379 16 2 3,088 6. Motor ized two wheelers such as motor cycles , scooters , mopeds and scooties are the largest contributors to road crashes in Kerala followed by Light Motor Vehicles (LMVs) such as motor cars, jeeps and taxies which are further followed by auto rickshaws . Road crash cases and deaths in Kerala based on vehicles primarily responsible : Mode of Transport Road Crashes Fatalities Motor i z ed Two - Wheeler 14,821 1,371 Heavy Artic u lated Vehicle/ Troll e y 432 117 Auto Rickshaw 4,402 303 Bus 3,766 608 Car/Jeep/Taxi/Van 1 1, 298 1,001 Bicycle 0 0 Cycle Rikshaw 0 0 Hand Drawn Cart 0 0 Truck/Lorry 2,186 510 Tempo /Tractor 1,565 221 Animal Drawn Cart 0 0 Others 0 0 7. In 201 7 , Ker

3 ala saw the highest number of deaths
ala saw the highest number of deaths of users of two - wheeler s and the second highest death of pedestrians due to road crashes : Male Female Total Pedestrians 1,0 67 2 6 5 1,332 Two - Wheelers 1,640 210 1,850 Bicycles 1 02 20 122 Auto Rickshaws 1 6 3 4 5 2 0 8 Cars, Taxis, Vans and LMV 204 107 311 Trucks/Lorries 1 38 17 155 Buses 64 33 97 Other Motor Vehicles 21 4 25 Other Persons 22 9 31 8. Crash victims killed in Kerala in 2017 according to their age and sex are as follows: Male Female Less than 18 176 55 18 - 25 544 113 25 - 35 561 102 35 - 45 673 104 45 - 60 755 16 4 60 and Above 712 172 9. Distribution of road crashes in Kerala based on responsibility of the driver is listed in the following table . “ Exceeding lawful speed’ is the biggest contributor to road crashes in Kerala in a cause - wise classification . Cause of Road Crash Crashes Injur ies Fatalities Exceeding lawful speed 34,119 37,715 3,679 Intake of Alcohol 1 33 178 7 Driving on the wrong side 1,254 1,431 109 Using mobile phones while driving 1 1 0 Jumping red light 406 2 3 412 10. F atalities due to non - wearing of safety devices in Kerala : Drivers Passengers Total Non - wearing of Helmet 432 390 822 Non - wear

4 ing of Seat - belt 158 1,511 1,669
ing of Seat - belt 158 1,511 1,669 11. Road crash cases, injuries and fatalities due to Overloading in Kerala in 201 7 : Cause of Road Crash Crashes Injured Fatalities Overloading 1,279 1,524 216 12. Road crash cases, persons injured and deaths due to Hit and Run incidences are high in Kerala . The following are the numbers pertaining to the same: Crashes Injured Fatalities Hit and Run 333 620 43 13. Road crash case s , persons injured and deaths in Kerala by location type : 14. Kochi was the city with the highest road crashes in Kerala while Kollam was the highest in terms of road crash fatalities and Khozikode was the highest in terms of road crash severity : Kannur Khozikode Kochi Kollam Thiruvananthapuram Thrissur Fatal Crashes 67 168 132 20 2 169 103 Injury Crashes 477 1, 150 2,149 1,515 1,880 1,184 Total Crashes 578 1,467 2,503 1,780 2,113 1,384 Total Persons Injured 700 1, 544 2,600 1,763 2,497 1,548 Total Persons Killed 68 184 137 213 172 106 Crash Severity 11.8 12.5 5.5 12. 0 8.1 7.7 Location of Road Crash Crashes Injured Fatalities Open A rea 24,681 26,445 2,530 Residential Area 9,565 10,994 1, 151 Market /Commercial Area 1,689 2,355 198 Institutional Area 2 , 535 2,877 2